- •The main difference between last-click and multi-touch attribution is how they assign credit. Last-click attributes the entire conversion to the final touchpoint, while multi-touch looks across the journey and assigns credit to multiple interactions. That makes last-click better for measuring conversion capture and multi-touch better for understanding broader marketing contribution.
- •A multi-touch attribution model does not automatically produce accurate results simply because it considers more touchpoints. The underlying data still needs to be reliable, with complete tracking, clean CRM data, consistent campaign tagging, accurate identity resolution, and a methodology that reflects how customers actually buy.
- •Tools like AttributeIQ can be used to analyse last-click and multi-touch performance side by side. Marketers can compare channel influence across attribution models, understand which channels contributed to successful journeys, and use that information to make more informed budget allocation decisions.
Last-Click or Multi-Touch Attribution: Which One Should You Use?
For most B2B organisations, multi-touch attribution provides a more complete view of marketing impact, while last-click attribution remains useful for tracking direct conversion performance. The better choice depends on sales cycle length, channel complexity, and reporting objectives.
The table below compares both approaches across credit allocation, accuracy, data requirements, strengths, limitations, and ideal use cases.
Recommended Reading: Signs You Need to Upgrade From GA4 to an MTA Software
How Accurate Is Last-Click Attribution for B2B Marketing Measurement?
Last-click attribution is only partially accurate because it gives the final interaction all the credit, even when that interaction was simply the last step in a much longer buying process. A branded search might close the loop, for example, but it says very little about the content, campaigns, conversations, and experiences that made the buyer search for the brand in the first place.
Below is a sample customer journey showing how last-click reporting can create an incomplete revenue picture, distort channel performance, and influence poor budget allocation decisions.
Imagine this deal appears in your quarterly marketing review.
Daniel Hughes from Orbitly signs a £24,000 annual contract after a five-day buying journey involving three measurable marketing interactions before requesting a demo.
Under last-click attribution, the revenue narrative becomes:
- Organic search: 0% credit
- LinkedIn: 0% credit
- Direct: 100% credit (£24,000)
On paper, direct traffic appears to be the channel that created the opportunity, so the logical response would be to invest more heavily in bottom-of-funnel activity and reduce spend elsewhere.
What This Looks Like at Scale
Now apply the same reporting model across a full year of pipeline. A single deal may not change budget decisions, but repeated across hundreds of opportunities, the same attribution gap can materially influence where marketing investment goes.
Consider a typical B2B organisation with:
- Annual deal volume: 120 opportunities
- Average deal value: £20,000
- Total annual pipeline: £2,400,000
- Marketing budget: £2,400,000
Current budget allocation:
- Top-of-funnel (organic, content, social): £960,000 (40%)
- Mid-funnel (nurture, events, webinars): £600,000 (25%)
- Bottom-of-funnel (paid search, direct response): £840,000 (35%)
Because last-click reporting makes top-of-funnel content look like an underperforming line item, leadership proposes reallocating 15% of the total budget (£360,000) away from early-stage demand creation to double down on the bottom-of-funnel channels that appear to be closing all the revenue.
- Amount shifted: £360,000
- Source: Top-of-funnel (reduced by £360,000)
- Destination: Bottom-of-funnel (increased by £360,000)
New budget allocation:
- Top-of-funnel: £600,000 (25%)
- Mid-funnel: £600,000 (25%)
- Bottom-of-funnel: £1,200,000 (50%)
The Cost in Content and Pipeline Generation
At first, the reallocation may look like a sensible response to the data. But reducing top-of-funnel investment by 37.5%, from £960,000 to £600,000, also means pulling back on the activities that build awareness and create future demand. Over time, organic content production slows, search visibility weakens, and inbound lead volume starts to fall.
The Financial Impact
- Total annual pipeline: £2,400,000
- Assume 65% of deals (78 of 120) involve multiple interactions and rely on top-of-funnel activity to enter the funnel. That represents £1.56 million of pipeline influenced by the awareness layer.
- A 35–45% decline in organic traffic proportionally reduces new-opportunity creation from that channel by the same rate
- 35–45% of £1,560,000 = £546,000–£702,000 pipeline at risk
This is the cost of relying on last-click attribution when your customer journey spans multiple months and multiple channels.
Make smarter budget decisions with multi-touch attribution insights.
With AttributeIQ, you can track the journey from a prospect’s first interaction to a closed deal and understand how each channel contributes along the way.
Try 14 days for free →Is Multi-Touch Attribution More Accurate Than Last-Click Attribution?
Multi-touch attribution is generally more accurate than last-click attribution for B2B marketing measurement because it reflects the reality of how buyers actually move through the funnel. Instead of giving all revenue credit to the final interaction, it shows how different channels, campaigns, and content contribute across the journey.
However, the accuracy of that view still depends on the quality of the underlying data, tracking, and CRM records behind the model.
What Determines Multi-Touch Attribution Accuracy in B2B Marketing?
The table below outlines the areas that most directly influence whether multi-touch attribution data provides a reliable view of channel contribution and revenue impact.
Recommended Reading: Multi-Touch Attribution Data Requirements Checklist
How to Choose the Right Multi-Touch Attribution Model for Your Business Goals
The right MTA model depends on how your revenue is actually generated. A company with a short conversion cycle and limited channel mix may gain little from complex attribution, while a B2B organisation with long sales cycles, multiple stakeholders, and distributed marketing influence needs a broader view of the customer journey.
Comparing Last-Click and Multi-Touch Attribution Inside AttributeIQ
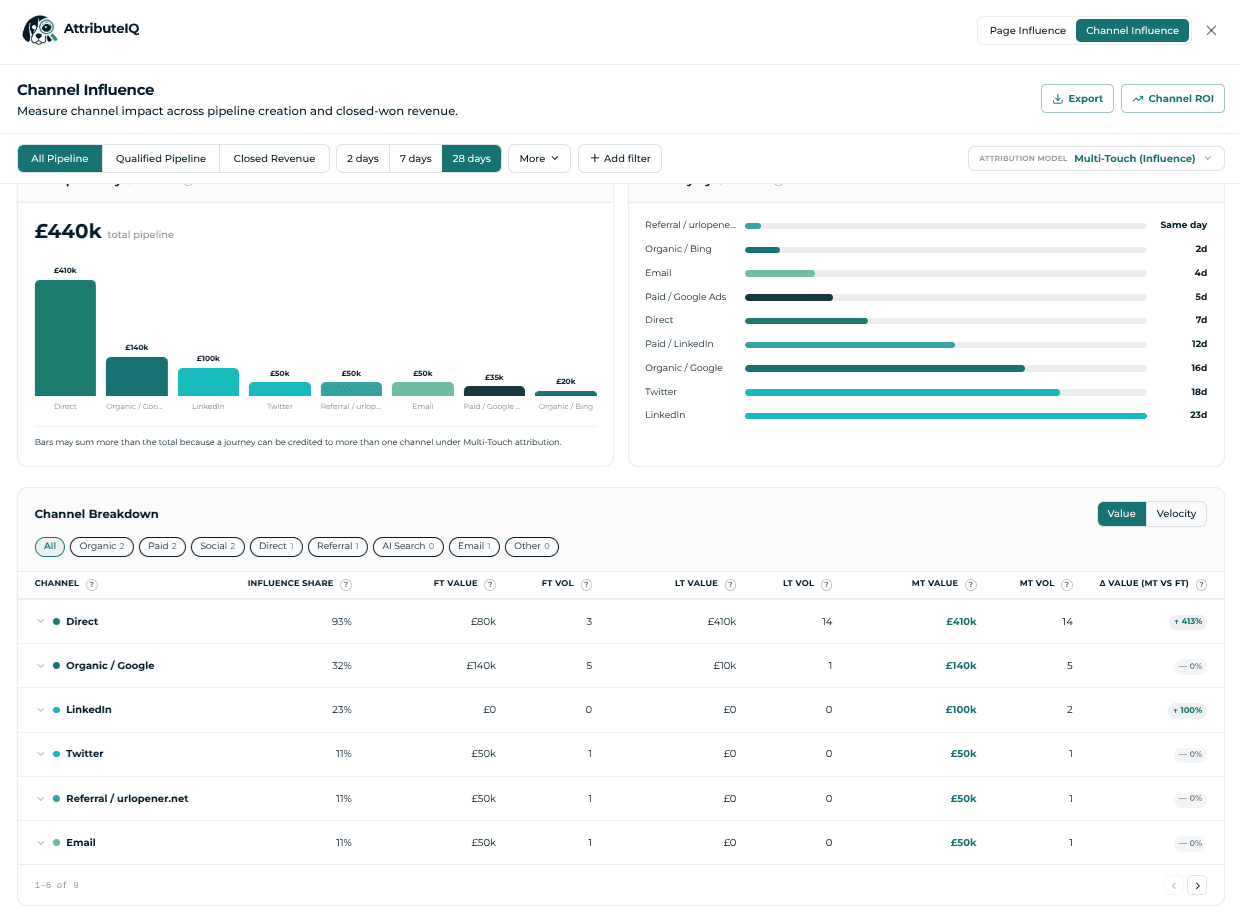
Inside AttributeIQ, the Channel Influence view lets you compare last-click performance with the wider set of channels involved across all successful buyer journeys. You can see which channels helped create pipeline and which continued to influence buyers before revenue was recorded.
So instead of seeing only:
- Direct: £410k last-touch value
- Organic / Google: £10k last-touch value
Teams can see how those same channels contributed across every journey that closed:
- Direct influenced £410k across 14 journeys
- Organic / Google influenced £140k across 5 journeys
- LinkedIn, referral, and email can each be evaluated on their role throughout the buying process, rather than being written off for lacking a final click
That distinction also matters when the conversation moves from reporting to budget allocation.
Take Organic as an example. Last-click gives it credit for £10k in revenue. Multi-touch shows £140k. From a last-click perspective, Organic may seem like a low-priority investment. But with the full customer journey in view, it becomes clear that Organic was involved in opportunities worth fourteen times more revenue.
That is the practical value of multi-touch attribution. It gives you enough context to understand how channels contribute across the journey before making a decision that could affect future pipeline.
If your current reporting only shows the final conversion source, AttributeIQ helps you connect marketing activity to revenue across the full customer journey. You can see which channels influenced opportunities, compare attribution models, and make budget decisions with a clearer view of what is actually driving pipeline. Try it free for 14 days→