- •The clearest signs you’ve outgrown GA4 and need to invest in multi-touch attribution (MTA) are longer sales cycles, multiple channels contributing to deals, larger buying committees, and uncertainty around where marketing budget should go.
- •MTA implementation demands baseline data maturity across your existing technology stack. You must maintain consistent campaign tracking, standardised lead sources, and a clean integration between your analytics and CRM system.
- •AttributeIQ can be set up in less than 15 minutes, with most teams seeing their first multi-touch attribution insights within 24–48 hours.
How to Know When It’s Time to Move Beyond GA4 Attribution
Your GA4 reports can be technically accurate and still leave you without clear answers when leadership starts asking what is truly driving revenue, which campaigns are influencing pipeline, and where your next pound of budget should go.
Use the five criteria below to evaluate if your operation has hit the point where upgrading to a multi-touch attribution platform makes sense.
Recommended Reading: Setting Up Multi-Touch Attribution Without Any Coding
The Revenue Impact of Delaying Multi-Touch Attribution: How Last-Click Reporting Misallocates Marketing Budget
Default web analytics can make the last step in a buyer’s journey look more important than everything that came before it. Over time, marketing teams may end up investing in the channels closest to conversion while underestimating the content, campaigns, and interactions that helped create the opportunity in the first place.
The sample customer journey from AttributeIQ below shows how this plays out in practice, demonstrating how last-click logic misrepresents true channel contribution:
Imagine this deal appears in your quarterly marketing review.
Daniel Hughes from Orbitly signs a £24,000 annual contract after a five-day buying journey involving three measurable marketing interactions before requesting a demo.
Under last-click attribution, the revenue narrative becomes:
- Organic search: 0% credit
- LinkedIn: 0% credit
- Direct: 100% credit (£24,000)
On paper, direct traffic appears to be the channel that created the opportunity, so the logical response would be to invest more heavily in bottom-of-funnel activity and reduce spend elsewhere.
What This Looks Like at Scale
Now apply the same reporting model across a full year of pipeline. A single deal may not change budget decisions, but repeated across hundreds of opportunities, the same attribution gap can materially influence where marketing investment goes.
Consider a typical B2B organisation with:
- Annual deal volume: 120 opportunities
- Average deal value: £20,000
- Total annual pipeline: £2,400,000
- Marketing budget: £2,400,000
Current budget allocation:
- Top-of-funnel (organic, content, social): £960,000 (40%)
- Mid-funnel (nurture, events, webinars): £600,000 (25%)
- Bottom-of-funnel (paid search, direct response): £840,000 (35%)
Because last-click reporting makes top-of-funnel content look like an underperforming line item, leadership proposes reallocating 15% of the total budget (£360,000) away from early-stage demand creation to double down on the bottom-of-funnel channels that appear to be closing all the revenue.
- Amount shifted: £360,000
- Source: Top-of-funnel (reduced by £360,000)
- Destination: Bottom-of-funnel (increased by £360,000)
New budget allocation:
- Top-of-funnel: £600,000 (25%)
- Mid-funnel: £600,000 (25%)
- Bottom-of-funnel: £1,200,000 (50%)
The Cost in Content and Pipeline Generation
At first, the reallocation may look like a sensible response to the data. But reducing top-of-funnel investment by 37.5%, from £960,000 to £600,000, also means pulling back on the activities that build awareness and create future demand. Over time, organic content production slows, search visibility weakens, and inbound lead volume starts to fall.
The Financial Impact
- Total annual pipeline: £2,400,000
- 65% of deals (78 of 120) are multi-touch and rely on top-of-funnel activity to enter the funnel in the first place: £1,560,000 of pipeline depends on that awareness layer
- A 35–45% decline in organic traffic proportionally reduces new-opportunity creation from that channel by the same rate
- 35–45% of £1,560,000 = £546,000–£702,000 pipeline at risk
This is the cost of relying on single-touch attribution when your customer journey spans multiple months and multiple channels.
Make smarter budget decisions with multi-touch attribution insights.
With AttributeIQ, you can track the journey from a prospect’s first interaction to a closed deal and understand how each channel contributes along the way.
Try 14 days for free →Setting Up Multi-Touch Attribution With AttributeIQ: A Step-by-Step Guide
Once you’ve decided to move beyond GA4, the next step is implementing a multi-touch attribution system that connects your marketing activity to pipeline and revenue.
This guide walks through the setup process in AttributeIQ, from connecting your data sources to reviewing your first attribution reports.
Step 1: Connect Your GA4 Property to AttributeIQ
When you create an AttributeIQ account, the onboarding flow starts with a GA4 connection.
Everything downstream, from journey tracking to your Multi-Touch Attribution reporting, depends on this being the right property.
Select Your GA4 Property
Once you’ve selected your property, AttributeIQ automatically starts syncing your raw GA4 event data from BigQuery. That’s what makes it possible to trace a buyer’s entire path, from first-touch to closed won. Most teams are connected and waiting for their first data sync within 24 hours of signing up.
Step 2: Connect HubSpot to Unlock Revenue Attribution
GA4 provides visibility into digital engagement, while HubSpot connects those interactions to pipeline and revenue outcomes. Until these systems are connected, marketing teams can see activity and deals separately but cannot reliably measure which channels and content influenced revenue.
Inside AttributeIQ, go to Settings → Integrations → HubSpot and click Connect HubSpot. You’ll be taken through a standard OAuth flow, authorise access, get redirected back, and you’ll see your portal ID confirmed and the status showing “Connected.”
Worth noting: the HubSpot integration is available on the Pro plan and above (from £149/mo). Without it, AttributeIQ still works, you’ll see which pages and channels drive conversions, just without the pipeline value and closed revenue attached to them.
Recommended Reading: How to Integrate GA4 with HubSpot Using AttributeIQ
Step 3: Review the Multi-Touch Attribution Report
Inside AttributeIQ, the Multi-Touch Attribution View shows you both page and channel influence, giving you a complete view of what contributes to pipeline and closed revenue.
Page Influence
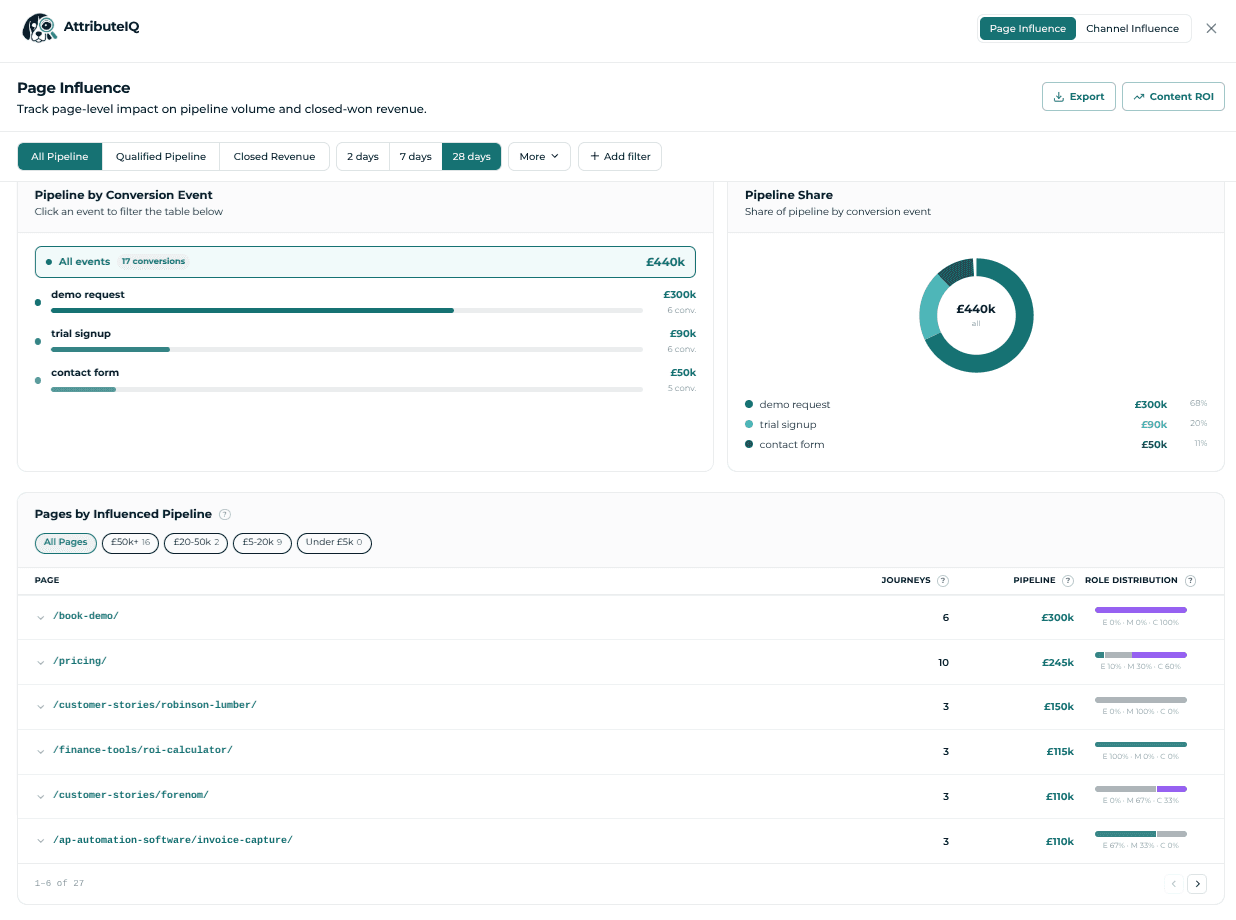
The Page Influence tab helps you answer:
1) Which pages are contributing most to pipeline and closed-revenue?
The Page Influence table ranks pages based on the amount of pipeline and revenue associated with visitors who interacted with them during their buying journey. Filter by size (£50k+, £20–50k, and so on) to identify the pages with the greatest influence on high-value opportunities.
2) Where does each page contribute across the customer journey?
Each page’s role distribution shows how it contributes throughout the customer journey: attracting new visitors (Entry), supporting evaluation (Mid), or helping drive conversions (Closer). Most Balanced Page flags content that pulls weight across all three, which is a strong signal for what your best-performing content actually looks like.
3) Which specific buyers engaged with which pages, and in what order?
Click into any page and it expands into the individual journeys behind it, the person, their company, and the full sequence of pages they visited before converting, in chronological order. This turns a page-level number into an actual account list, useful when sales wants to know who’s already been reading the pricing page before a call.
Channel Influence
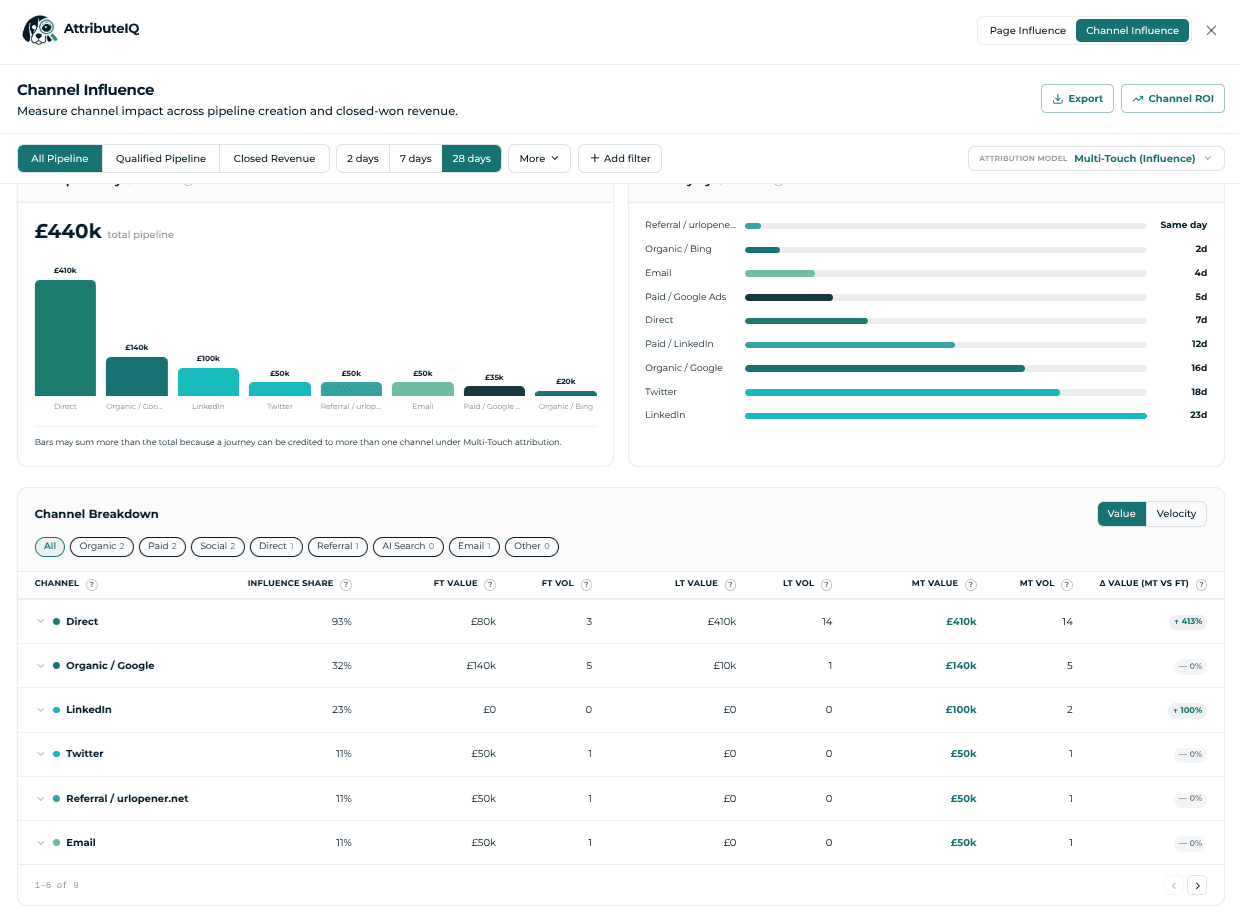
The Channel Influence tab helps you answer:
1) Which channels are actually contributing to pipeline and closed revenue?
Toggle between All Pipeline, Qualified Pipeline, and Closed Revenue to see how channel influence changes throughout the sales cycle. Some channels play a bigger role early in the journey, while others become more visible closer to conversion. The Channel Breakdown table updates with each view, showing the pipeline value and deal volume associated with every channel.
2) Where should I be putting more marketing spend?
Most Active Channel tells you which source shows up most consistently across buyer journeys, a strong signal for where to protect or increase spend. Fastest Converting Channel shows which one moves opportunities to conversion quickest, useful when you’re optimising for speed over volume.
3) Which accounts came through which channels, and how often did it touch the deal?
Expand any channel row and you get the individual journeys behind it, plus a note on exactly where that channel showed up in the sequence, once early on, or at nearly every step through to conversion. This tells you whether a channel is a one-touch introduction or a channel your buyers keep coming back to throughout the deal.
Everything above takes about
24 hours to set up on your own data.
No implementation call, no sales demo first. Connect GA4, connect HubSpot, and see your own pipeline and revenue broken down by page and channel.
Try 14 days for free →Moving into internal alignment and need to convince finance this actually matters? This CFO-focused business case guide walks through how to frame ROI, payback period, and budget risk in language finance actually responds to.
Frequently Asked Questions
Upgrading your measurement stack shouldn’t require a three-month enterprise onboarding or a massive consulting bill. If your sales cycles are long and GA4 is giving direct traffic all the credit, the cost of making blind budget decisions far outweighs the price of getting real visibility. Plug in your GA4 and HubSpot properties in 15 minutes, and start seeing true multi-touch attribution insights within 24 hours. Try AttributeIQ Free for 14 Days →