Different teams need different views of content performance. Here’s how the leading content attribution platforms compare in 2026:
- Best for page-level content-to-revenue attribution: AttributeIQ
- Best for enterprise B2B revenue attribution: Dreamdata
- Best for GTM and account-level intelligence: HockeyStack
- Best for content engagement and asset consumption tracking: PathFactory
- Best for editorial content analytics: Parse.ly
- Best for sales content and enablement attribution: Highspot
Best Content Attribution Software Comparison Table for 2026
B2B buying journeys keep getting longer, and content attribution has gotten harder to pin down along with them. A prospect might read a few articles, grab a guide, come back through an email nudge, then talk to sales before anything closes, so figuring out which content actually moved the deal isn’t straightforward anymore.
To fix that, more teams are turning to content attribution platforms that connect those interactions with pipeline and revenue. Below, we compare the top tools for 2026 based on their strengths, ideal use cases, setup time, and pricing.
1. AttributeIQ
Best for: Content and demand gen leaders using HubSpot and GA4 who need to prove which specific pages, guides, and posts are moving contacts toward pipeline and closed revenue.
AttributeIQ is a multi-touch attribution platform built for B2B marketing teams that need a defensible, page-level view of how their content drives pipeline. It combines GA4 content engagement data with HubSpot deal records to show exactly which blog posts, guides, and case studies contacts read on their way to becoming pipeline and closed-won revenue.
Property
Attribution
Account
jent@nexa.com

Page Influence
Track page-level impact on pipeline volume and closed-won revenue performance.
Total Pipeline
£40.80k
Total Journeys
22
Top High-Value Page
/b2b-sales-lead-scoring
Most Balanced Page
/sales-rep-onboarding
Pipeline by Conversion Event
All pipeline · click an event to filter the journeys below
Pipeline Share
Share of pipeline by conversion event
£40.80k
Pages by Influenced Pipeline
Pricing starts at £89/month on the Starter plan, which covers page-level and multi-touch content attribution across your full site. The Pro plan at £149/month adds CRM-connected content-to-revenue reporting, Board Summary with PPTX exports, and buyer intent alerts triggered by content re-engagement. Both plans include a 14-day free trial with no credit card required. See full pricing.
Core Features
Journey Explorer provides a contact-level view of every touchpoint that leads to a deal, including website visits, content interactions, and conversion events. Instead of saying “this content probably helped,” teams can go deal by deal and show the exact journey behind the opportunity, from the first article they read to the pages they engaged with before converting.
Board Summary brings marketing attribution into a single executive view, showing how content, channels, and campaigns contribute to pipeline and revenue. For B2B teams, this means finally being able to walk into a board meeting and show, with numbers, the revenue impact of content, without manually aggregating data from three different systems.
Property
Attribution
Management
Account
jane@nexa.com
Board Summary
Export a board-ready summary of marketing’s influence on pipeline and revenue.
Q2 2026 · Board Summary · 1 Apr 2026 – 30 Jun 2026
Qualified Pipeline
£4.1M
from 47 contacts
Total Revenue
£1.27M
from 14 closed deals
Avg Closed Deal
£90.7k
from 14 closed deals
Top Account
Nexa
£340k influenced
Deal Tracking & Alerts gives you a visceral, real-time pulse of buyer intent the second an active deal engages with your high-stakes assets. Whether a prospect is bingeing case studies, scrubbing your security docs, or hovering over pricing, you get unfiltered visibility into exactly which content is pushing pipeline across the finish line.
Pros
- Live content-to-pipeline attribution in under 24 hours. Enterprise content attribution platforms often require weeks of data engineering, custom tracking, and analytics resources before showing which content influences revenue. AttributeIQ connects directly with GA4 and HubSpot, allowing teams to start analysing content journeys and pipeline impact almost immediately.
- Flexible attribution views. AttributeIQ lets you understand content performance through first-touch, last-touch, and multi-touch attribution, showing how individual pages, articles, and resources contribute to pipeline and revenue.
- Accessible pricing for content-led teams. Starting at £149/month, AttributeIQ provides content-to-revenue attribution and page-level reporting without the five-figure annual contracts common among enterprise attribution platforms.
- No dashboard dependency for content questions. Pro users can ask attribution questions conversationally through Claude-powered analytics instead of manually building reports to understand which content influenced pipeline.
Cons
- No historical content attribution before installation. Because the software connects content engagement to HubSpot contacts moving forward, it cannot reconstruct buyer journeys that happened before tracking was installed. For teams with longer B2B sales cycles, you’ll need a few months of live tracking before the numbers start to feel reliable enough to act on.
- Limited CRM ecosystem support. AttributeIQ works best for teams using supported platforms like HubSpot and GA4. Organisations running other CRM systems may need to evaluate whether the available integrations support their attribution needs.
- Starter plan limits multi-property tracking. Starter tier supports a single GA4 property, which may not fit organisations managing multiple regional websites, brands, or separate content hubs. Teams with broader content operations will need the Pro plan.
Prove your content’s revenue impact, page by page
AttributeIQ gives your team a clear view of which content drives business results, from first engagement through pipeline and revenue. Starts at £149/mo. Live in under 24 hours.
Try it free for 14 days →2. Dreamdata
Best for: Enterprise B2B teams that need content attribution connected to a broader, account-level revenue data platform.
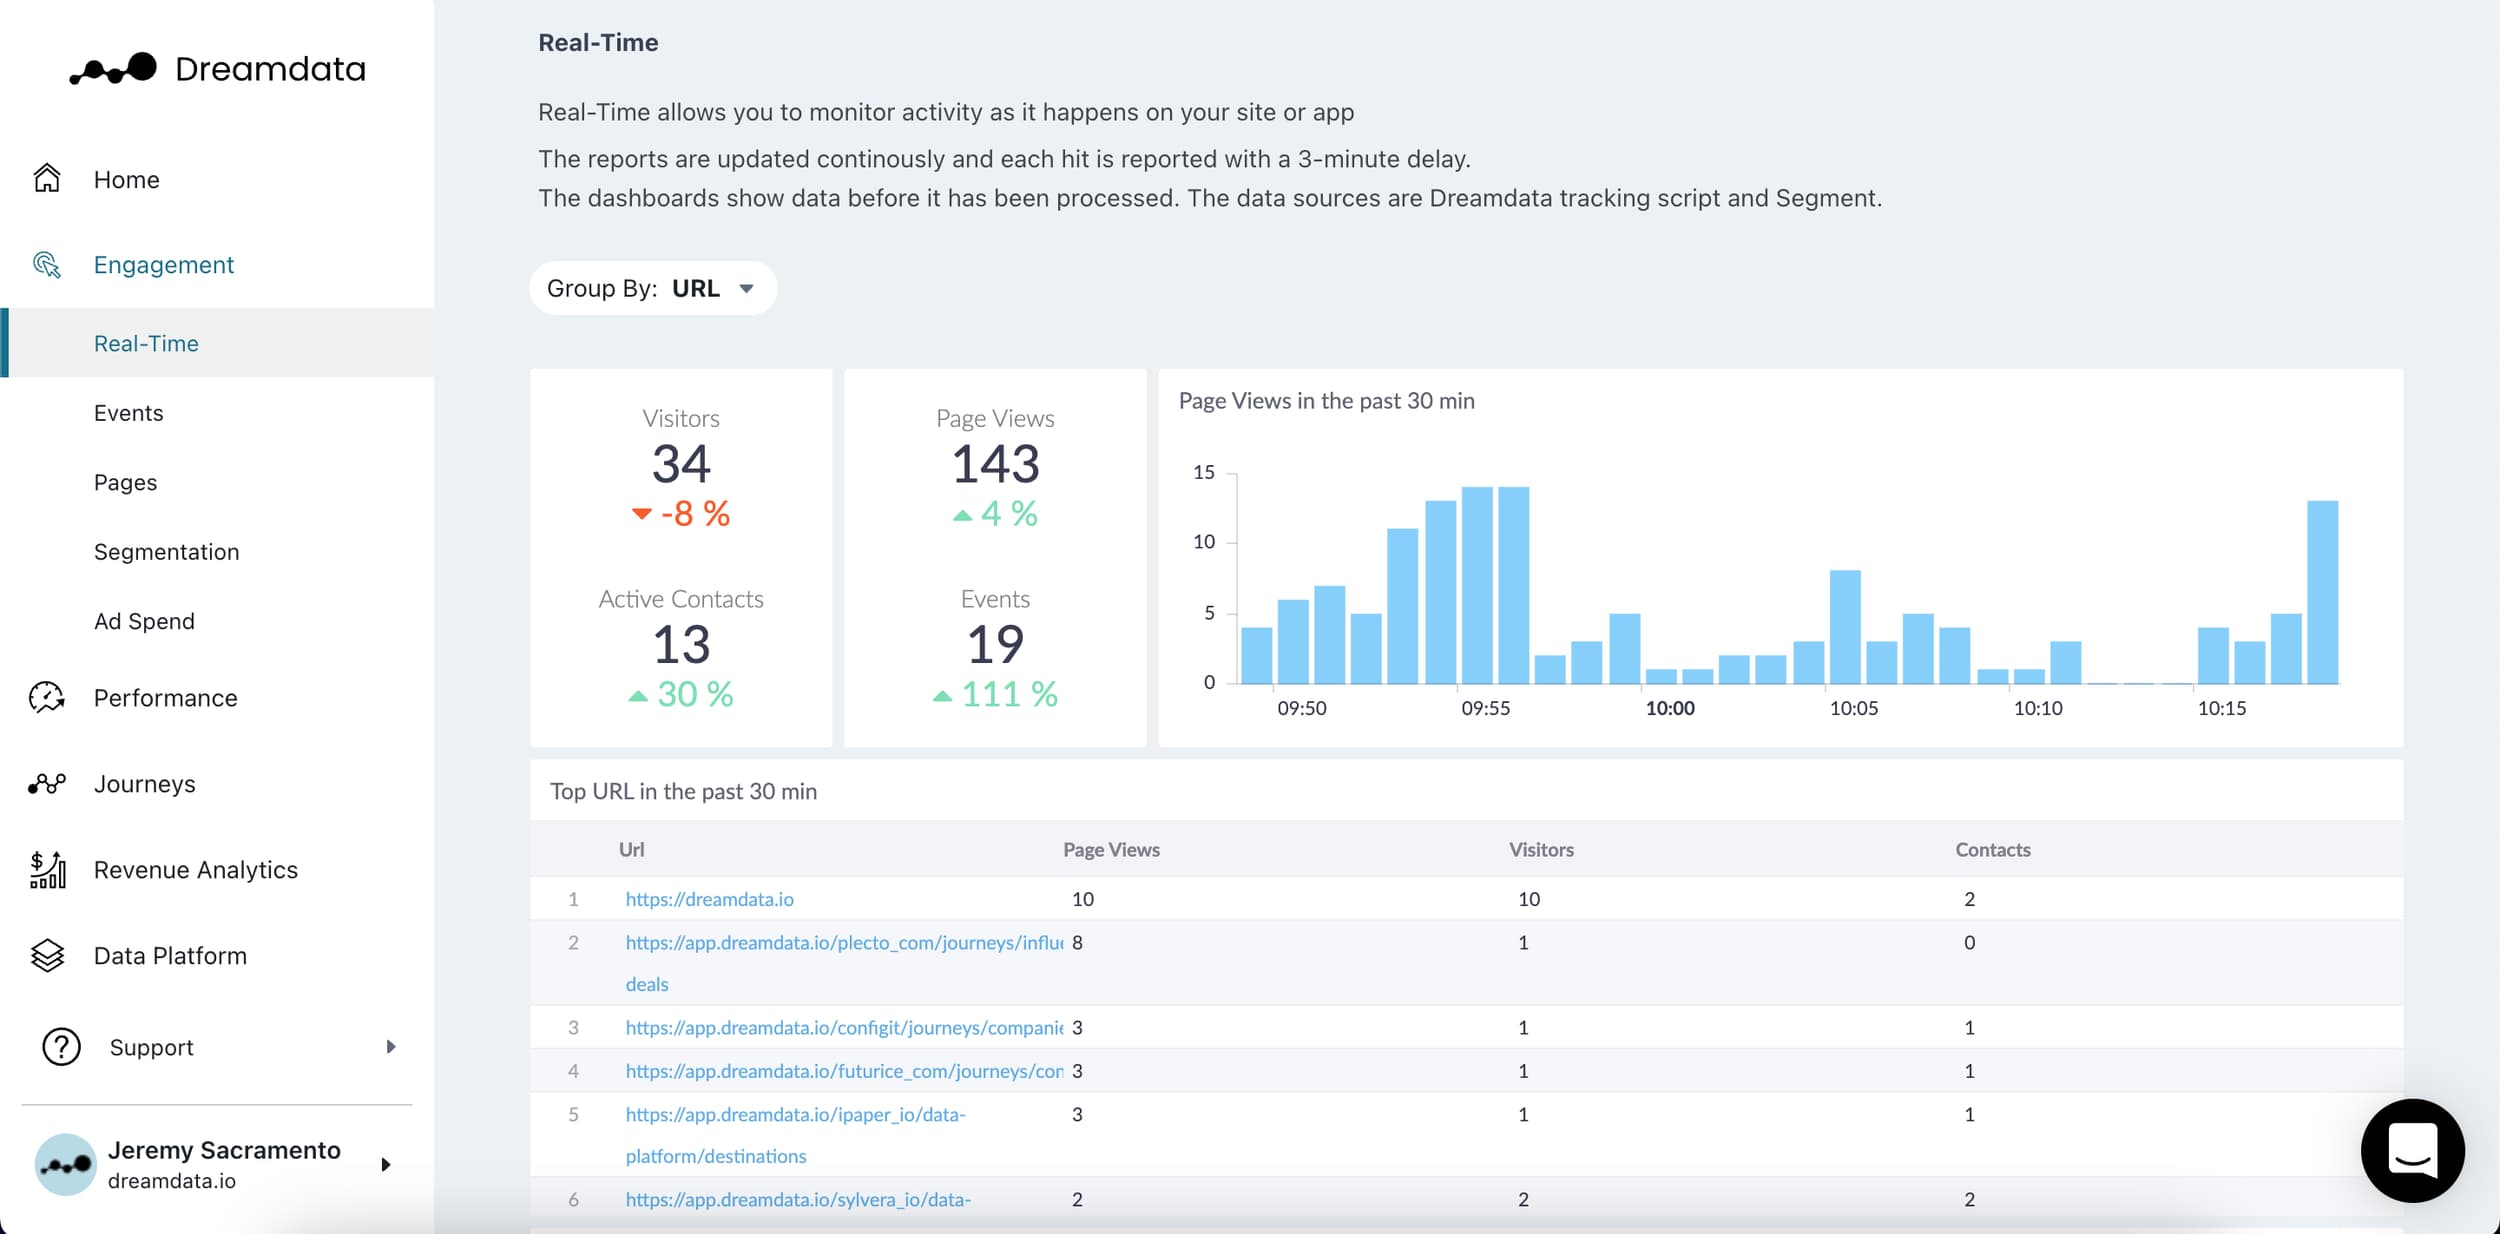
Dreamdata helps B2B teams measure how content contributes to revenue by combining website activity, content engagement, campaigns, and CRM data into one attribution model. Instead of viewing content separately, teams can see how assets fit into wider account journeys alongside paid campaigns, sales interactions, and other touchpoints.
Pricing
Dreamdata does not publish fixed pricing. Plans are based on tracked contacts, data volume, and connected sources. Entry-level packages are estimated around $2,000/month, with enterprise deployments increasing based on reporting needs and integrations.
Core Features
- Account-level content journeys. Dreamdata shows how multiple stakeholders at an account interact with your content before a deal closes, helping teams understand the role content plays across longer B2B buying cycles.
- Multi-touch content attribution models. Teams can apply first-touch, last-touch, or custom attribution models to measure how much influence content assets have compared with other marketing and sales activities.
- Content revenue reporting inside a unified data model. Content interactions, campaign activity, and CRM data are analysed together, allowing teams to compare content’s contribution to pipeline against other revenue-driving channels.
Cons
- Content attribution is part of a larger revenue model. Dreamdata is built for full-funnel revenue attribution, so teams looking primarily for page-level content reporting or content performance rankings may find the platform broader than they need.
- Heavy 3–5 week implementation curve. Modeling content touches alongside CRM data, ad accounts, and product usage requires dedicated RevOps or data engineering support before reports stabilise.
- Enterprise pricing structure. At $12k–$40k+/year, this isn’t a tool a Head of Content can put on a corporate card, it requires cross-departmental buy-in and CFO sign-off.
3. PathFactory
Best for: Content marketing teams that need deeper engagement data to understand how buyers consume content before creating pipeline.
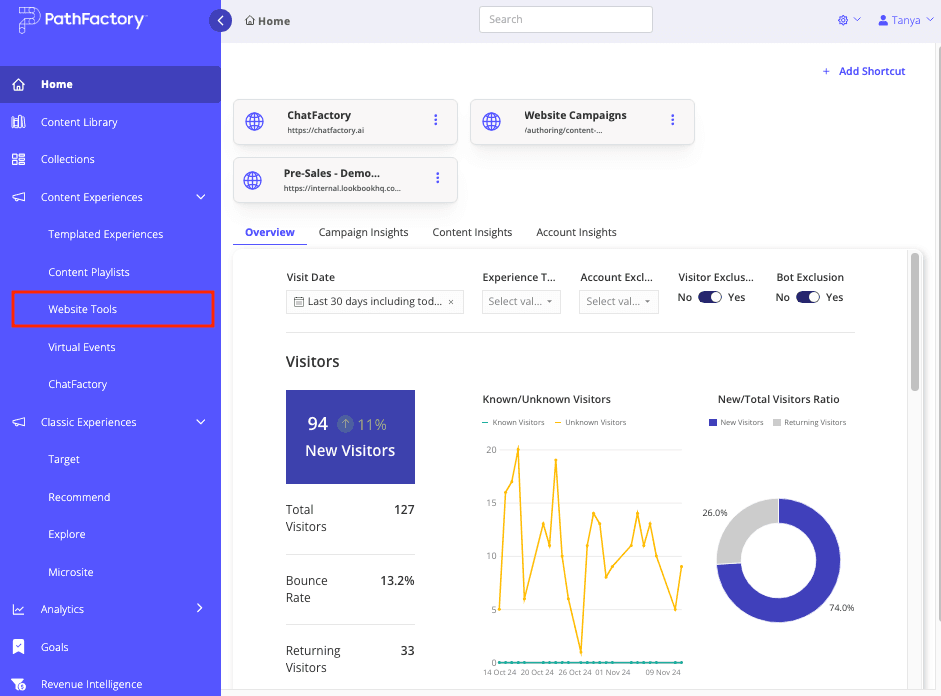
PathFactory tracks how long buyers spend consuming individual assets rather than just clicking or downloading them. It measures active attention down to the second across PDFs, videos, and resource hubs, feeding those consumption signals straight into your CRM to prove pipeline influence.
Pricing
PathFactory does not publish fixed pricing. Plans are typically based on content volume, users, and enterprise requirements, starting around $15,000/year and increasing for larger deployments.
Core Features
- Active content consumption tracking: PathFactory measures how deeply prospects engage with content, including time spent on assets, repeat visits, and content progression, helping teams identify which resources genuinely capture buyer attention.
- Content tracks and binge session attribution: Groups related content into bingeable, multi-asset experiences, so teams can see when accounts engage with several pieces in one session and connect that engagement to pipeline.
- CRM-native engagement signals: Feeds account-level reading data straight into Salesforce or HubSpot, letting sales reps see the exact pages and topics an account researched before outreach.
Cons
- Requires proprietary content hosting: Deep engagement tracking requires serving PDFs and videos through PathFactory’s player, which can disrupt site architecture and native URL structures.
- Limited to structured hubs, not site-wide web attribution: Built specifically for collateral, resource centers, and landing pages, not for mapping organic blog journeys across an entire domain.
- High entry cost and management overhead: At $15k+/year, it requires a dedicated content operations team to consistently curate, update, and manage content tracks.
4. HockeyStack
Best for: B2B teams that want content attribution connected to wider GTM and account-level revenue reporting.
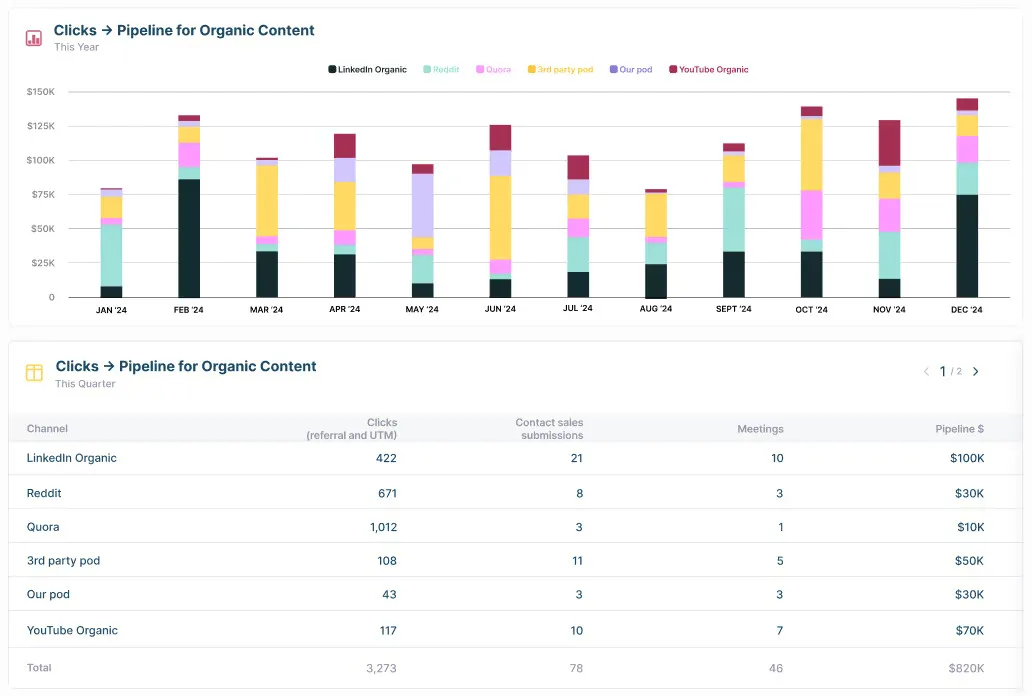
HockeyStack helps B2B teams understand how content contributes to pipeline by combining website activity, content engagement, advertising data, product usage, and sales interactions into one revenue view. Instead of analysing content performance in isolation, teams can see where content fits within the broader buyer journey and how it supports account progression.
Pricing
HockeyStack does not publish fixed pricing. Plans are custom-quoted based on tracked accounts, connected data sources, and required features. Annual contracts are commonly estimated between $15,000 and $50,000+, depending on deployment size and reporting needs.
Core Features
- Account-level content journeys. HockeyStack shows how content interactions fit into wider account journeys, helping teams understand how multiple stakeholders engage with content before a deal closes.
- AI-powered attribution insights. Teams can ask questions about content performance and pipeline influence using natural language, reducing the need to manually build attribution reports.
- Unified revenue reporting. Content engagement, marketing activity, sales interactions, and product data are analysed together, giving teams one view of how different touchpoints contribute to revenue.
Cons
- Broader than a dedicated content attribution tool. HockeyStack combines content attribution with wider GTM analytics, which may be more than content teams need if they only want page-level content performance reporting.
- Longer implementation timeline. Connecting content data with CRM, product usage, advertising, and sales activity requires more setup, with deployments often taking several weeks before reporting is reliable.
- Enterprise pricing structure. With annual costs often reaching five figures, HockeyStack is better suited for teams with larger marketing budgets and dedicated RevOps resources.
5. Parse.ly
Best for: Content teams that need real-time visibility into content performance, audience engagement, and editorial impact.
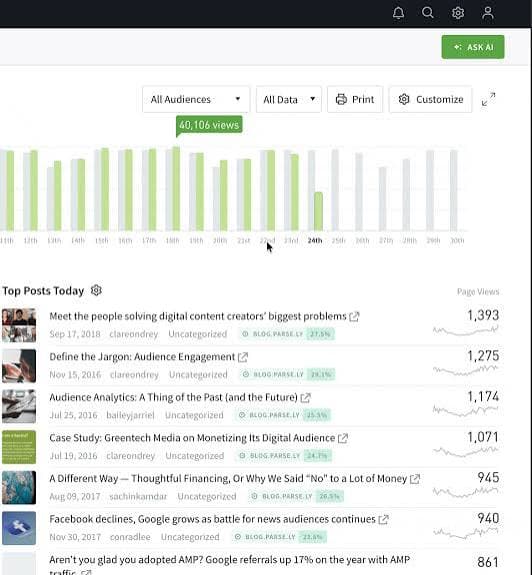
Parse.ly helps content teams understand which articles, topics, and authors drive audience engagement by analysing content performance across their website. Instead of focusing only on traffic metrics, teams can see which content attracts attention, keeps visitors engaged, and contributes to goals like subscriptions, conversions, or lead generation.
Pricing
Parse.ly does not publish fixed pricing. Plans are custom-quoted based on website traffic, content volume, and reporting requirements.
Core Features
- Content performance analytics. Parse.ly shows how individual articles, topics, authors, and content categories perform, helping teams understand which content consistently attracts and engages their audience.
- Real-time content reporting. Teams can monitor how newly published content performs across channels like search and social, allowing them to quickly identify what is gaining traction.
- Conversion tracking for content goals. Parse.ly connects content engagement with business outcomes such as newsletter signups, subscriptions, and conversions, helping teams measure the impact of their editorial strategy.
Cons
- Limited B2B revenue attribution. Parse.ly is built around content performance and audience engagement rather than complex B2B pipeline tracking, making it less suitable for teams that need to connect content directly to CRM opportunities and closed revenue.
- More suited to publishers than demand generation teams. Its analytics are designed for content-heavy organisations and media workflows, so B2B SaaS teams looking for account journeys and pipeline attribution may need a more revenue-focused platform.
6. Highspot
Best for: Sales enablement teams that need to measure how bottom-of-funnel content influences deals after sales engagement begins.
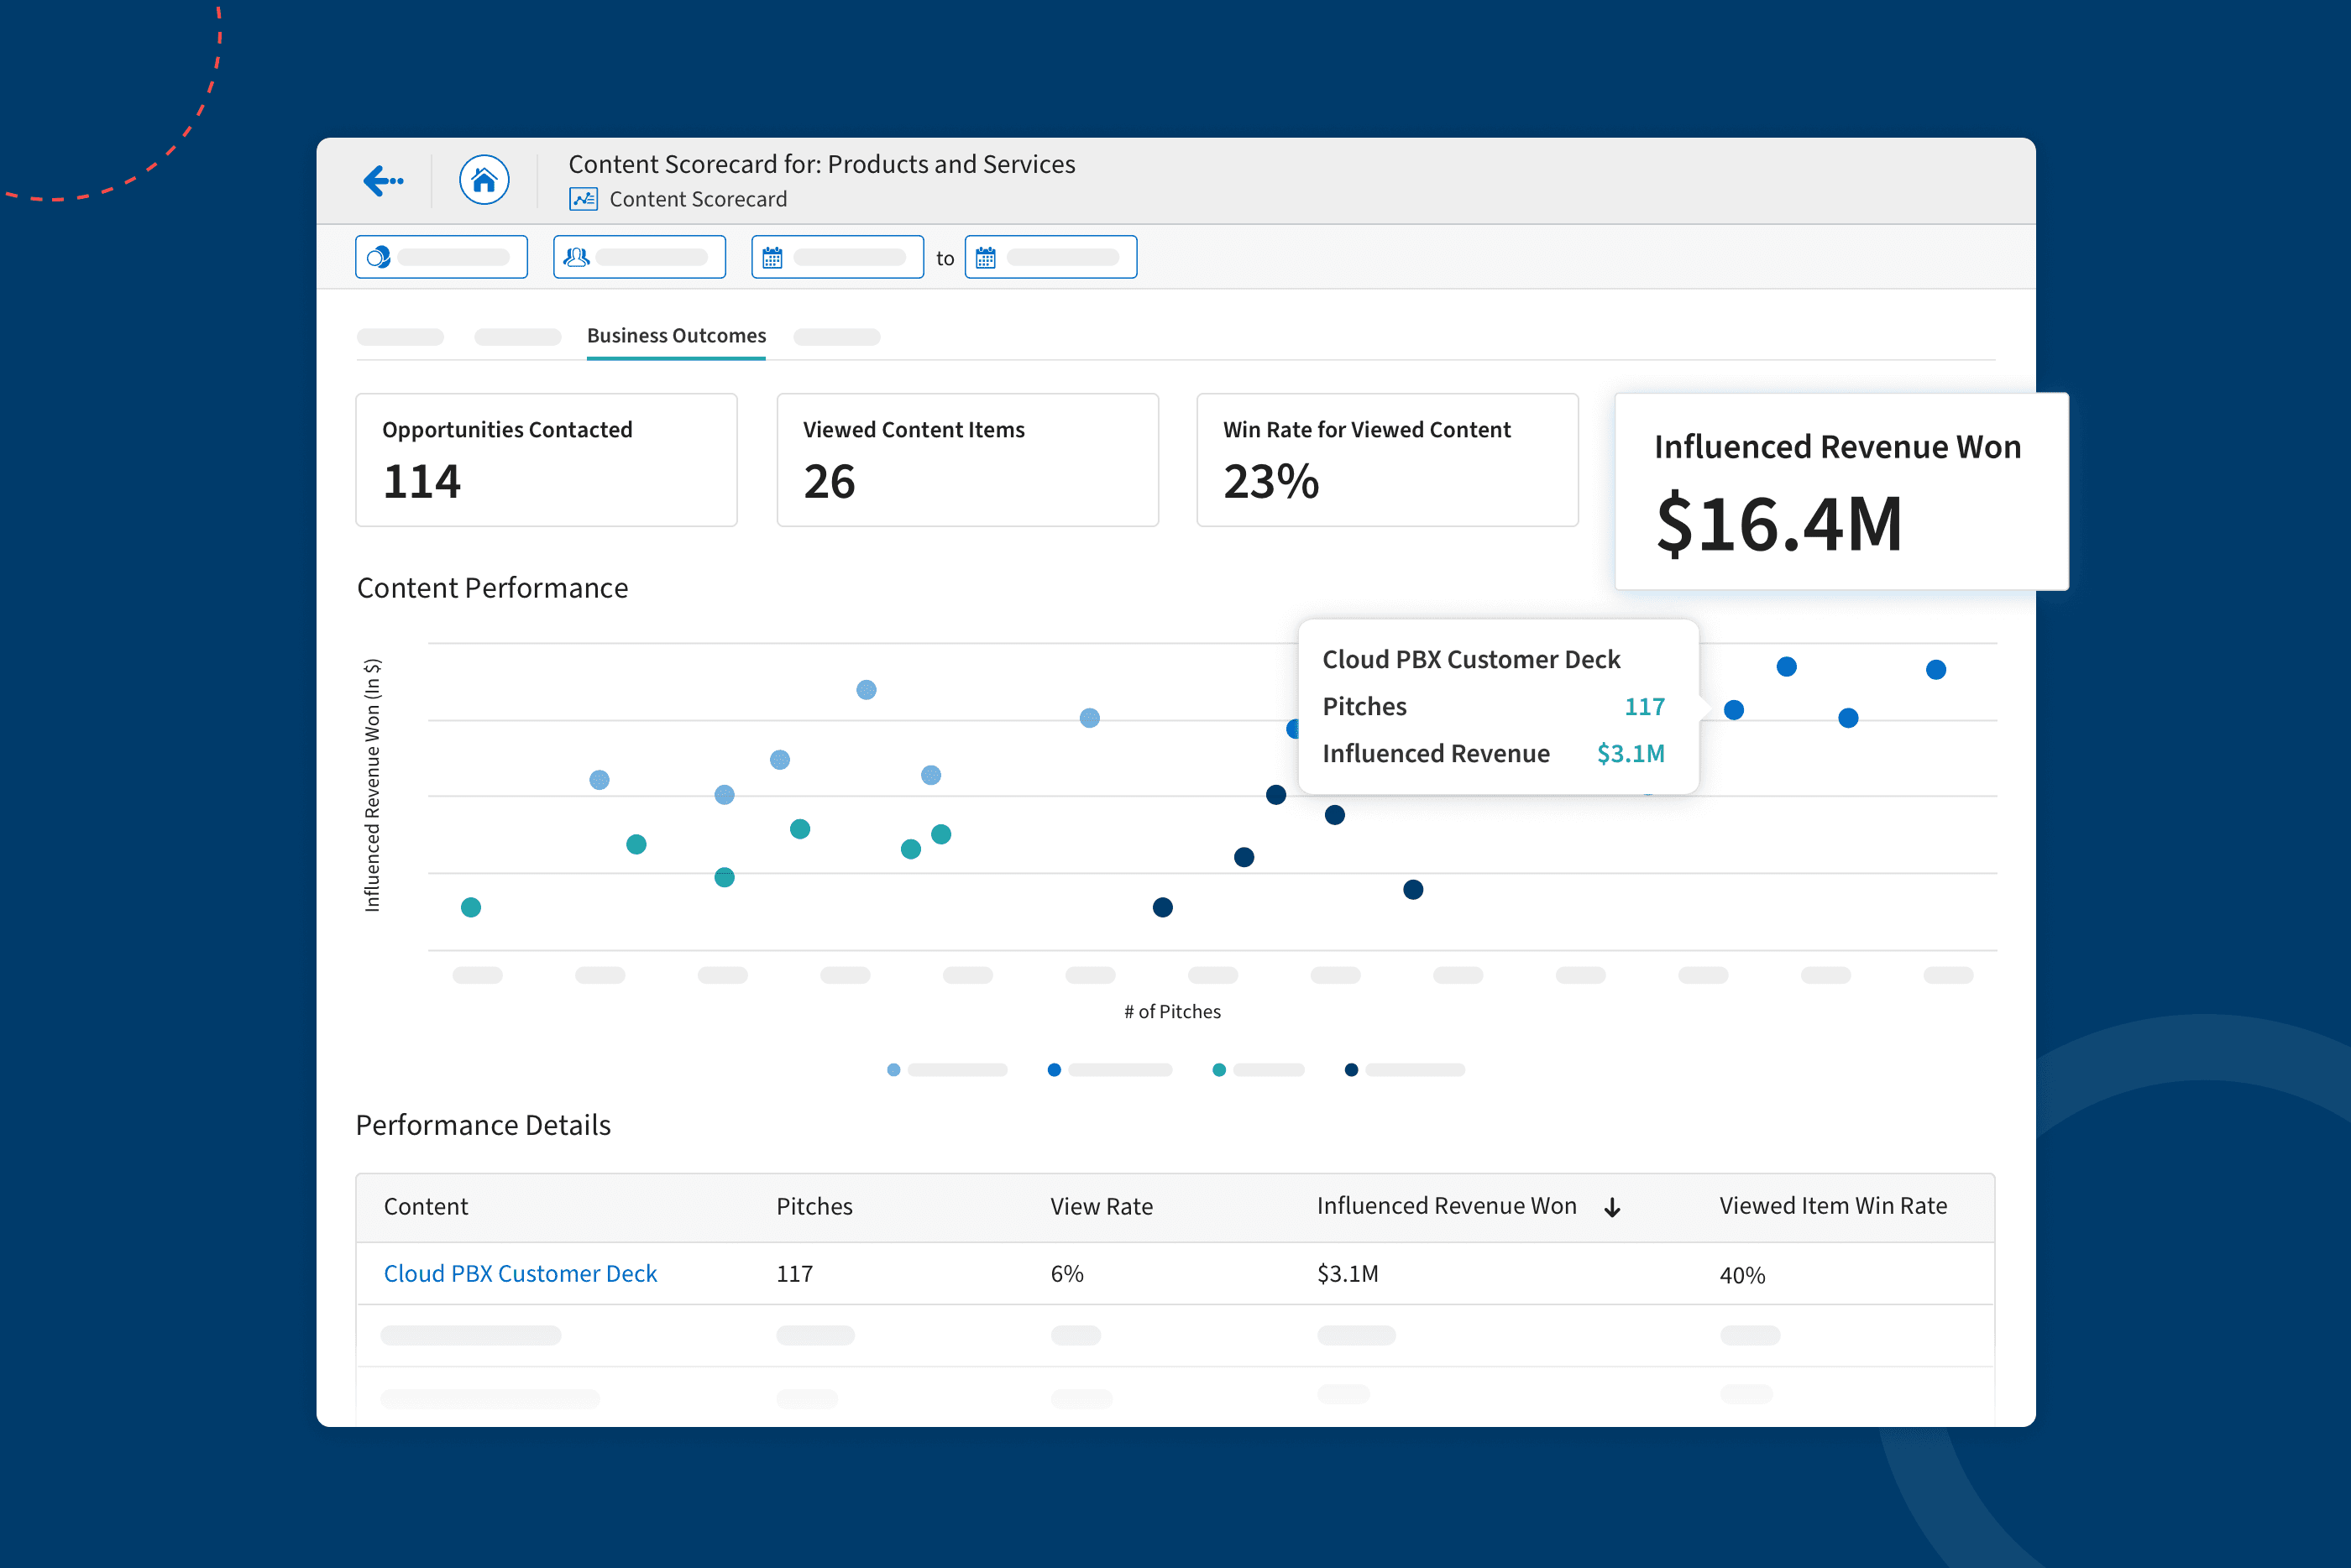
Highspot helps B2B teams understand how sales content contributes to revenue by tracking how prospects interact with decks, battlecards, proposals, and other buyer-facing assets. Instead of measuring website content journeys, Highspot focuses on the content used during active sales conversations and shows how those assets influence deal progression and win rates.
Pricing
Highspot does not publish fixed pricing. Plans are typically based on the number of users, required features, and deployment size. Pricing is commonly estimated around $600 per user/year, with enterprise contracts increasing based on team size and requirements.
Core Features
- Sales content engagement tracking. Highspot shows which sales assets prospects interact with during a deal, helping teams understand which decks, documents, and resources are most involved in moving opportunities forward.
- Content influence on closed deals. Connects content engagement data with CRM outcomes, helping marketing teams identify which sales materials appear most often in successful deals.
- CRM-connected content workflows. Integrates with platforms like Salesforce and Dynamics so sales teams can access relevant content directly within their existing deal workflows.
Cons
- Focused on sales content, not full content journeys. Highspot is designed around sales enablement assets rather than tracking how blogs, guides, and website content contribute to pipeline before sales involvement.
- Requires sales adoption to capture value. Teams need consistent usage from sales reps to ensure content interactions are tracked and connected to real opportunities.
- Enterprise pricing model. With per-user pricing and larger deployment requirements, Highspot is better suited for established sales teams than smaller content teams looking for standalone attribution.
How to Choose the Best Content Attribution Software for Your Team
Now that you’ve seen how these six platforms stack up, here’s how to pick the right one for your team, without getting swayed by feature lists alone.
1. Where does your sales and pipeline data live?
Before comparing features, check whether each content attribution platform integrates cleanly with the CRM your revenue team already uses.
- HubSpot-centric teams: Look for lightweight tools like AttributeIQ that plug in instantly.
- Salesforce-centric teams: Require deep, custom-object mapping found in platforms like Dreamdata or PathFactory.
- Non-standard / Custom CRMs: Require flexible webhook setups found in platforms like HockeyStack or Dreamdata.
2. What kind of content do prospects engage with most?
A platform should measure the content formats that influence your buying journey, rather than only tracking the easiest assets to capture.
- Blogs, Website Pages, & Web Forms: Tools like AttributeIQ or HockeyStack are perfect.
- Gated PDFs & Video Assets: PathFactory offers deeper time-on-asset metrics.
- Sales Decks & 1:1 Collateral: Highspot is required to track rep-sent assets.
3. Which team is responsible for keeping reporting accurate?
Some tools work with minimal support, while others need RevOps or data teams to manage integrations, rules, and ongoing maintenance.
- Content/Marketing team (No RevOps support): Choose plug-and-play, self-serve solutions like AttributeIQ that require zero engineering overhead.
- Dedicated RevOps / Data Engineering: Deploy customisable multi-touch systems like Dreamdata that need ongoing maintenance.
4. How quickly does your team need usable attribution data?
If stakeholders need answers this week, prioritise a tool with fast deployment over a more complex implementation that takes months.
- Immediate (Under 24 hours): AttributeIQ installs via a simple tracking script and instant API authentication.
- Long-term (4 to 6+ weeks): Dreamdata or HockeyStack require extensive RevOps alignment and data cleaning.
5. What budget can your team commit to beyond the first month?
Compare total cost against the setup effort, required resources, and revenue visibility the platform will realistically deliver over time.
- Under $150/month: AttributeIQ offers a high-ROI entry point for growing content teams.
- $1,000+ /month: PathFactory, Dreamdata, and HockeyStack cater to enterprise budgets.
6 Mistakes That Undermine Every Content Attribution Tool Evaluation
Attribution data is only as credible as the systems and operating discipline behind it. Even the strongest platform will produce misleading reports if key touchpoints are missing, CRM data is unreliable, or no team owns the process.
A useful evaluation question for any vendor is: Can this platform produce reporting that Finance, Sales, and Marketing will all recognise as credible enough to use in investment decisions?
First 90 Days: Proving ROI with Your Content Attribution Platform
Buying content attribution software does not automatically create a reliable view of content ROI. The first 90 days should establish trust in the data, turn early findings into investment decisions, and build an operating rhythm that keeps reporting credible over time.
Frequently Asked Questions
Choosing the right content attribution platform comes down to seeing how well it answers your real business questions. Connect your CRM, analyse which content influenced opportunities, and confirm the reporting is useful before committing. Try AttributeIQ free for 14 days and see for yourself.