- •Dreamdata is the stronger choice for enterprise RevOps teams, that need warehouse-level control, deeper attribution modelling, and complex account journey analysis. HockeyStack is better suited for GTM teams that prioritise speed, real-time insights, AI analysis, and sales activation.
- •Both platforms represent significant investments, with realistic first-year costs reaching roughly $40K–$50K once software, onboarding, and internal resources are included.
- •AttributeIQ delivers the core attribution capabilities most B2B teams need, with faster implementation and transparent pricing. At £149/month, teams get multi-touch revenue attribution, board reporting, and pipeline visibility without the $40K–$50K first-year investment of Dreamdata or HockeyStack.
Dreamdata vs HockeyStack: Key Differences At a Glance
The table below gives you a practical view of how Dreamdata and HockeyStack compare across features, pricing, and implementation. We’ve included AttributeIQ alongside them for teams that want to start measuring marketing influence quickly, without needing a warehouse project or a long implementation cycle.
Choosing Between Dreamdata and HockeyStack for B2B Attribution
In this Dreamdata and HockeyStack comparison, we break down how both platforms approach B2B attribution, where their strengths differ, and what trade-offs teams should consider around data architecture, reporting, AI capabilities, and implementation.
Dreamdata vs HockeyStack: Feature Strength at a Glance
1. Identity Resolution & Account-Level Journey Stitching
The core challenge in B2B attribution is stitching fragmented buyer activity, across contacts, sessions, and channels, into a single coherent account journey. It’s even a harder problem in longer sales cycles, where multiple stakeholders influence one opportunity over an extended period. Dreamdata and HockeyStack solve this through fundamentally different architectures, with real consequences for setup time and data control.
Dreamdata
Approaches identity resolution through its warehouse-based architecture, giving teams full control over how CRM data, marketing touchpoints, and account relationships are combined and modeled, down to the SQL layer.
HockeyStack
Uses Atlas to provide a real-time view of account engagement, bringing together anonymous and known interactions into a single journey timeline. The focus is on giving GTM teams faster access to behavioural insights and account intelligence.
2. Attribution Modeling Flexibility & Customization
Attribution requirements evolve as GTM teams mature. Early-stage teams may need simple visibility into influential channels, while larger organisations often require different models for pipeline reporting and budget allocation. Dreamdata and HockeyStack both address this, but the question is how much customisation each allows once standard models no longer match your GTM motion.
Attribution Model Comparison
Custom / algorithmic models configure weighting dynamically based on custom rules and machine learning, and aren't shown as fixed bars above.
Dreamdata
Offers seven standard attribution models out of the box, with additional flexibility through custom modelling within its warehouse-based architecture. Teams can adjust weighting logic, incorporate offline touchpoints, and build more complex attribution frameworks around their existing data model.
HockeyStack
Provides configurable attribution models through a more user-facing interface, allowing teams to adjust attribution logic, compare models, and segment reporting without relying heavily on technical resources. This makes it easier for GTM teams to iterate on attribution views as reporting needs change.
3. Content, Campaign, & Indirect Influence Tracking
Content Influence is one of the harder areas of B2B measurement because many of the assets that shape buying decisions do not follow a clean conversion path. Teams increasingly need to understand not only which channels generate leads, but which content and campaigns contribute to pipeline progression throughout the buying journey.
Dreamdata
Measures content influence by connecting website interactions with account progression and revenue outcomes. Teams can analyse which pages, assets, and content experiences appear most frequently across successful customer journeys and compare their impact across opportunities.
HockeyStack
Uses features like Lift Analysis and Organic Influence tracking to show which content correlates with account engagement and pipeline movement, including influence from harder-to-measure sources such as ungated content and dark social.
4. AI Agents, Real-Time Intent Alerts, & GTM Automation
AI and automation capabilities are becoming a bigger differentiator as GTM teams move beyond reporting and look for systems that can show insights, identify buying signals, and trigger action without manual analysis. This is where Dreamdata and HockeyStack diverge most sharply, one stays close to reporting, the other builds automation directly into the workflow.
Dreamdata
Focuses primarily on analytics and reporting workflows, with capabilities such as performance anomaly detection and automated report digests. Teams can use these insights to understand revenue performance, but translating findings into GTM actions typically remains a manual process.
HockeyStack
Includes AI capabilities through Odin and Nova, combining natural-language data analysis with real-time GTM alerts. Teams can query performance data, identify revenue patterns, and receive notifications when accounts show high-intent behaviours, helping sales teams act on buying signals faster.
5. Implementation Complexity, CRM Hygiene, & Time-to-Value
Beyond features and reporting depth, the effort required to implement each platform often determines how quickly teams see real value, and that’s where Dreamdata and HockeyStack pull apart the most.
Implementation Timeline Comparison
Dreamdata Implementation (4–8 Weeks)
Requires more involvement from RevOps and data teams, including warehouse configuration, CRM field mapping, pipeline modelling, and data validation. This approach provides greater control over the underlying data model, but onboarding can take longer when account structures, lifecycle stages, or historical data require cleanup.
HockeyStack Implementation (2–6 Weeks)
Reduces the need for warehouse setup by relying on direct tracking and native integrations. Teams can typically get dashboards and reporting workflows running faster, although CRM accuracy and consistent lifecycle definitions remain important for reliable attribution.
Dreamdata vs HockeyStack Pricing: Plans, Costs, and Year-1 TCO Compared
Dreamdata and HockeyStack pricing can look very different depending on company size, data requirements, and the level of implementation support needed. Comparing only the subscription price misses the larger cost picture, especially for teams that need CRM integration, data modelling, reporting workflows, and ongoing RevOps support.
The comparison below looks at reported pricing ranges, implementation needs, and estimated first-year TCO to show what teams should expect when evaluating Dreamdata vs HockeyStack.
Dreamdata vs HockeyStack: Pricing Comparison at a Glance
Estimated Year-1 Cost Breakdown (Mid-Market)
Software cost is only one part of the investment. The table below estimates first-year commitment, including implementation effort and internal resources required to operate each platform.
Bottom line on Dreamdata vs HockeyStack pricing: The base subscription gap between Dreamdata and HockeyStack is minimal at the median contract level (~$27,000 vs ~$28,000). The real cost difference comes from implementation and ongoing overhead. Dreamdata’s warehouse-native model adds ~$8,000 in setup fees and ~$12,000 in internal data engineering time, while HockeyStack’s managed platform reduces those costs to ~$6,000 and ~$6,000 respectively. This creates a ~$7,000 year-one TCO gap in HockeyStack’s favor.
Dreamdata and HockeyStack ROI Compared: When Does Each Platform Make Financial Sense?
Whether Dreamdata or HockeyStack makes financial sense depends largely on the size of the marketing operation using it. For teams running smaller budgets, the platform cost can be difficult to justify, while larger teams can often recover the investment through better budget allocation, pipeline visibility, and more informed GTM decisions.
How We Calculated ROI for Dreamdata vs HockeyStack
To compare the two platforms on equal footing, we modeled ROI the same way a finance or RevOps team would evaluate any software purchase: does the extra revenue it generates outweigh what it costs to run in year one?
ROI Formula: (Incremental revenue from improved marketing decisions − Year-1 platform cost) ÷ Year-1 platform cost
Core assumptions (used in all scenarios)
- Revenue improvement from better marketing decisions: 10% (conservative)
- Pipeline to revenue close rate: 20%
- Average contract value (ACV): $25,000
- Efficiency gain comes from reallocating spend (not adding budget)
- Year-1 cost includes software + implementation + internal resources where needed
Scenario A: Mid-Market SaaS ($15M ARR, $350K Marketing Budget)
Baseline: $350,000 annual marketing budget | $2,100,000 pipeline | $420,000 closed-won revenue
10% revenue improvement from better marketing decisions = $42,000 incremental revenue
Verdict:At $350K in annual marketing spend, HockeyStack is close to breakeven under this model, with a ~$1,000 gap between estimated cost and incremental revenue. Dreamdata requires a slightly higher improvement at around 12%, largely due to the higher estimated operational overhead included in its TCO. Neither platform delivers a clear first-year return at this budget level, but both become easier to justify as marketing spend and the impact of attribution-driven decisions increase.
Scenario B: Enterprise B2B ($60M+ ARR, $2M Marketing Budget)
Baseline: $2M annual marketing budget | $14M pipeline | $2.8M closed-won revenue
10% revenue improvement from better marketing decisions = $280,000 incremental revenue
Verdict:At enterprise scale, both Dreamdata and HockeyStack generate substantial positive ROI, with the estimated first-year return driven by relatively small improvements in marketing efficiency. At this stage, the decision moves away from pure financial justification and toward strategic fit: Dreamdata’s warehouse-based flexibility and deeper control over attribution logic versus HockeyStack’s real-time GTM intelligence, AI capabilities, and workflow automation.
Dreamdata vs HockeyStack ROI: Final Takeaway
Dreamdata and HockeyStack both deliver positive ROI once marketing spend passes roughly $350K to $2M a year, with the required efficiency gain to break even dropping from about 10 to 12% at $350K to about 3 to 4% at $2M. At lower spend levels, the breakeven bar climbs high enough that either platform is hard to justify on cost alone, and teams are better served looking at a more affordable, lower-commitment option first.
A More Affordable Alternative to Dreamdata & HockeyStack: AttributeIQ
Both Dreamdata and HockeyStack are designed for teams with advanced attribution and GTM analytics requirements, but not every B2B team needs that complexity to understand marketing impact. Most teams just need a faster way to connect campaigns, content, and buyer interactions to pipeline and revenue outcomes while keeping setup, costs, and ongoing management manageable.
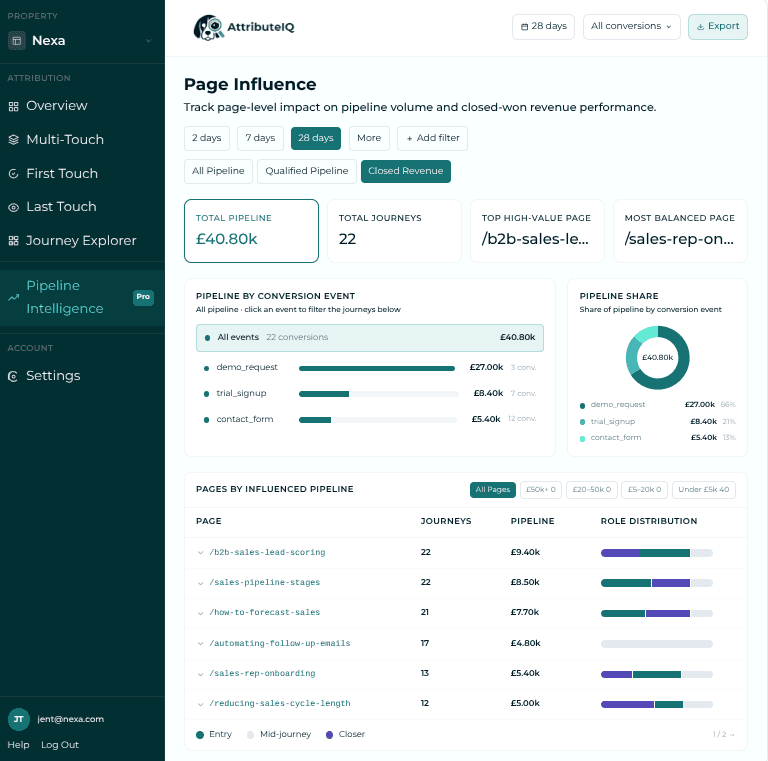
AttributeIQ is a multi-touch attribution platform that gives B2B teams clear visibility into marketing’s contribution to pipeline and revenue. It connects directly to GA4 and HubSpot, delivering contact-level journey mapping, multi-touch revenue attribution, and board reporting without a data warehouse or custom data engineering, usable data is typically available within 24 hours.
Core Features
Journey Explorer gives you a timeline for every converting contact: which pages they visited, in what order, from which channel, with time-on-page for each. You can see that Daniel at Orbitly found your attribution guide via organic search on March 19th, came back through LinkedIn four days later to read a case study, then hit pricing directly before requesting a demo on March 24th.
Dreamdata vs HockeyStack comparison: Dreamdata’s journey stitching runs on a data warehouse your team has to build and model first. HockeyStack’s Atlas takes 20 to 35 hours of CRM mapping before it’s reliable. AttributeIQ’s Journey Explorer connects directly to your GA4 and HubSpot data, with most teams seeing their first conversion paths within 24-48 hours.
Board Summary pulls page and channel attribution into one clean, exportable report. Instead of pulling numbers from three different dashboards and stitching them into a deck by hand, you get pipeline-by-content-and-channel numbers ready to export as a PPTX for your next board meeting.
Property
Attribution
Management
Account
jane@nexa.com

Board Summary
Export a board-ready summary of marketing’s influence on pipeline and revenue.
Q2 2026 · Board Summary · 1 Apr 2026 – 30 Jun 2026
Qualified Pipeline
£4.1M
from 47 contacts
Total Revenue
£1.27M
from 14 closed deals
Avg Closed Deal
£90.7k
from 14 closed deals
Top Account
Nexa
£340k influenced
Dreamdata vs HockeyStack comparison: Both platforms provide powerful attribution reporting, but teams often still need to assemble leadership-ready summaries themselves. Board Summary turns pipeline, revenue, channel influence, and content performance into a presentation-ready export, removing the manual work of pulling numbers across dashboards and rebuilding quarterly board decks.
Deal Tracking adds real-time intent signals on top of your attribution data. You can set alert rules so that the moment a known HubSpot contact visits a high-intent page, like pricing for the third time, or a case study the night before a renewal, you get a Slack notification right away, no dedicated admin required to build or maintain the rule.
Dreamdata vs HockeyStack comparison: Dreamdata doesn’t do real-time intent alerts on any plan, at any price. If a contact visits pricing three times in a day, you’re not finding out until someone happens to check the dashboard. HockeyStack does have alerts, through Atlas, but they’re locked behind GTM Execution, which runs close to $26K a year once you’re past the demo call. Deal Tracking ships standard in AttributeIQ Pro, roughly $2.2K a year, with no dedicated admin needed to build or maintain a rule.
Dreamdata vs HockeyStack vs AttributeIQ: Which Platform Fits Your GTM Motion?
There is no universal best choice when it comes to choosing an attribution platform. The right one depends on your company’s size, buying process, internal resources, and whether you need deeper control, faster insights, or simpler execution.
Choose AttributeIQ if
- You are under ~$20M ARR or do not have a dedicated data warehouse.
- You want contact-level attribution built directly on your existing GA4 and HubSpot data.
- You need usable reporting within days rather than a multi-week implementation.
- You want transparent pricing and the ability to start small before committing to an enterprise platform.
Choose Dreamdata if
- You already run BigQuery, Snowflake, or a similar warehouse environment.
- Your RevOps team needs deeper, hands-on control over CRM modelling and attribution logic.
- You operate complex, multi-stakeholder enterprise sales cycles.
- You have the resources to support ongoing data management.
Choose HockeyStack if
- You want real-time account intelligence without managing your own warehouse.
- Sales and marketing teams need self-serve dashboards and behavioural insights.
- You plan to use AI workflows and automated GTM signals.
- Your budget supports a higher-tier revenue intelligence platform.
Frequently Asked Questions
Dreamdata and HockeyStack are both powerful options for teams with the data maturity and GTM complexity to support them. But if you need a clearer view of what is driving pipeline without building a larger analytics stack around it, AttributeIQ gives you the essentials faster, with attribution data flowing within 24 hours. Try it free for 14 days.