The best multi-touch attribution software for B2B teams in 2026 is AttributeIQ if you’re on HubSpot and GA4 and want working pipeline data within 24 hours at the lowest entry cost. It’s Dreamdata or HockeyStack if your sales cycle runs 90+ days, your buying committee has five or more stakeholders, and Salesforce is your system of record. It’s Rockerbox if TV, direct mail, or podcasts are a real share of your budget. And it’s GA4 alone, for now, if your UTM tagging and conversion tracking aren’t clean enough yet to trust any paid tool.
Looking For the Best Multi Touch Attribution Software in 2026?
Buying multi-touch attribution (MTA) software is one of the highest-stakes decisions a marketing or RevOps leader can make. When implemented correctly, it reveals which content, campaigns, and channels are generating pipeline, helping you reallocate budget toward revenue-generating activity. When implemented poorly, it becomes an expensive dashboard that sales leadership ignores while engineering spends months maintaining it.
To narrow down the right platform for your stack and sales motion before booking a single demo, evaluate your options side-by-side across these core deployment metrics.
Multi-Touch Attribution Software Comparison: Leading Platforms Compared
1. AttributeIQ
Best for: Marketing leaders using HubSpot and GA4 who need multi-touch attribution defensible enough to prove content and channel influence on pipeline and closed revenue.
AttributeIQ is a multi-touch attribution platform designed for marketing teams operating across multiple campaigns, channels, and content types who need one consistent view of what’s driving pipeline. It connects GA4 and HubSpot at the data layer, reconciling website behavior with deal records so revenue attribution holds up under scrutiny from sales and finance.
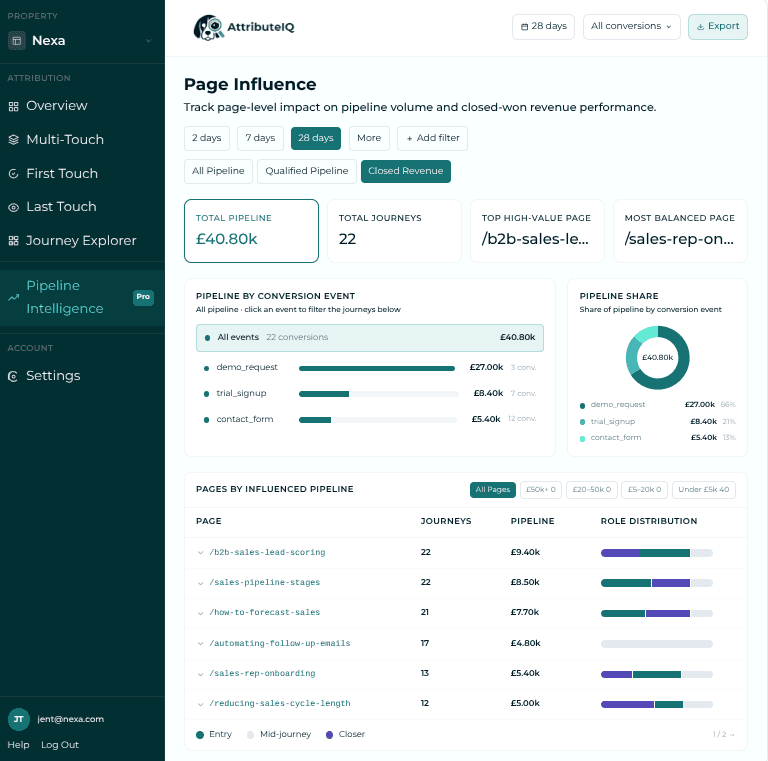
Pricing starts at £89/month on the Starter plan, which includes multi-touch attribution, unlimited Journey Explorer access, and daily and weekly Slack alerts. The Pro plan, at £149/month, adds Pipeline Intelligence, including multi-touch revenue attribution, Board Summary and PPTX export, and buyer intent tracking. Both plans include a 14-day free trial with no credit card required. See full pricing.
Core Features
Journey Explorer is a buyer journey analytics feature that visualises every marketing touchpoint leading to a conversion, from the first interaction through closed revenue. You can see that Daniel at Orbitly found your attribution guide via organic search on March 19th, came back through LinkedIn four days later to read a case study, then hit pricing directly before requesting a demo on March 24th.
Board Summary is a revenue reporting feature that brings page, channel, and campaign attribution into one executive-ready view. It shows which marketing activities influenced pipeline and closed revenue, giving marketing leaders a clearer way to report marketing impact without manually pulling data from multiple systems.
Property
Attribution
Management
Account
jane@nexa.com

Board Summary
Export a board-ready summary of marketing’s influence on pipeline and revenue.
Q2 2026 · Board Summary · 1 Apr 2026 – 30 Jun 2026
Qualified Pipeline
£4.1M
from 47 contacts
Total Revenue
£1.27M
from 14 closed deals
Avg Closed Deal
£90.7k
from 14 closed deals
Top Account
Nexa
£340k influenced
Deal Tracking is a real-time buyer intent tracking feature that fires alerts the moment a known contact revisits a high-intent page. You can set a rule for pricing, for example, and get a Slack notification the moment a contact hits it for the third time.
Pros
- Setup completes within 24 hours. Most multi-touch attribution platforms require weeks of engineering coordination before producing usable data. AttributeIQ connects to GA4 and HubSpot directly, and journey-level insights are available shortly after connection, without a ticket queue or implementation dependency chain.
- Accessible pricing for mid-market B2B teams. Starting at £89/month, AttributeIQ provides multi-touch attribution, journey analysis, and revenue reporting at a lower entry point than enterprise platforms such as Dreamdata and HockeyStack, making it suitable for teams that need attribution insights without a large software investment.
- Conversational analytics through Claude MCP is included on the Pro plan. This allows marketing teams to query attribution data in natural language rather than building custom reports or dashboards, reducing the technical overhead required to extract insight from the underlying data.
Cons
- No historical attribution before installation. AttributeIQ begins collecting attribution data after GA4 and HubSpot are connected, meaning existing customer journeys and deals cannot be analysed retroactively. Teams with active pipelines may need time to build a complete attribution dataset.
- Starter plan supports one GA4 property only. Companies managing multiple websites, regions, or product lines may need the Pro plan to analyse attribution across additional properties.
- Limited CRM integrations compared with enterprise platforms. AttributeIQ currently focuses on HubSpot integration, which may not suit larger organisations where Salesforce or another CRM is the primary source of opportunity data.
See exactly what drives pipeline from first touch to closed revenue.
AttributeIQ connects GA4 and HubSpot to reveal the content, channels, and campaigns influencing every deal, live within 24 hours.
Try 14 days for free →2. Dreamdata
Best for: B2B SaaS companies with complex sales cycles that need account-based multi-touch attribution across marketing, sales, and revenue teams.
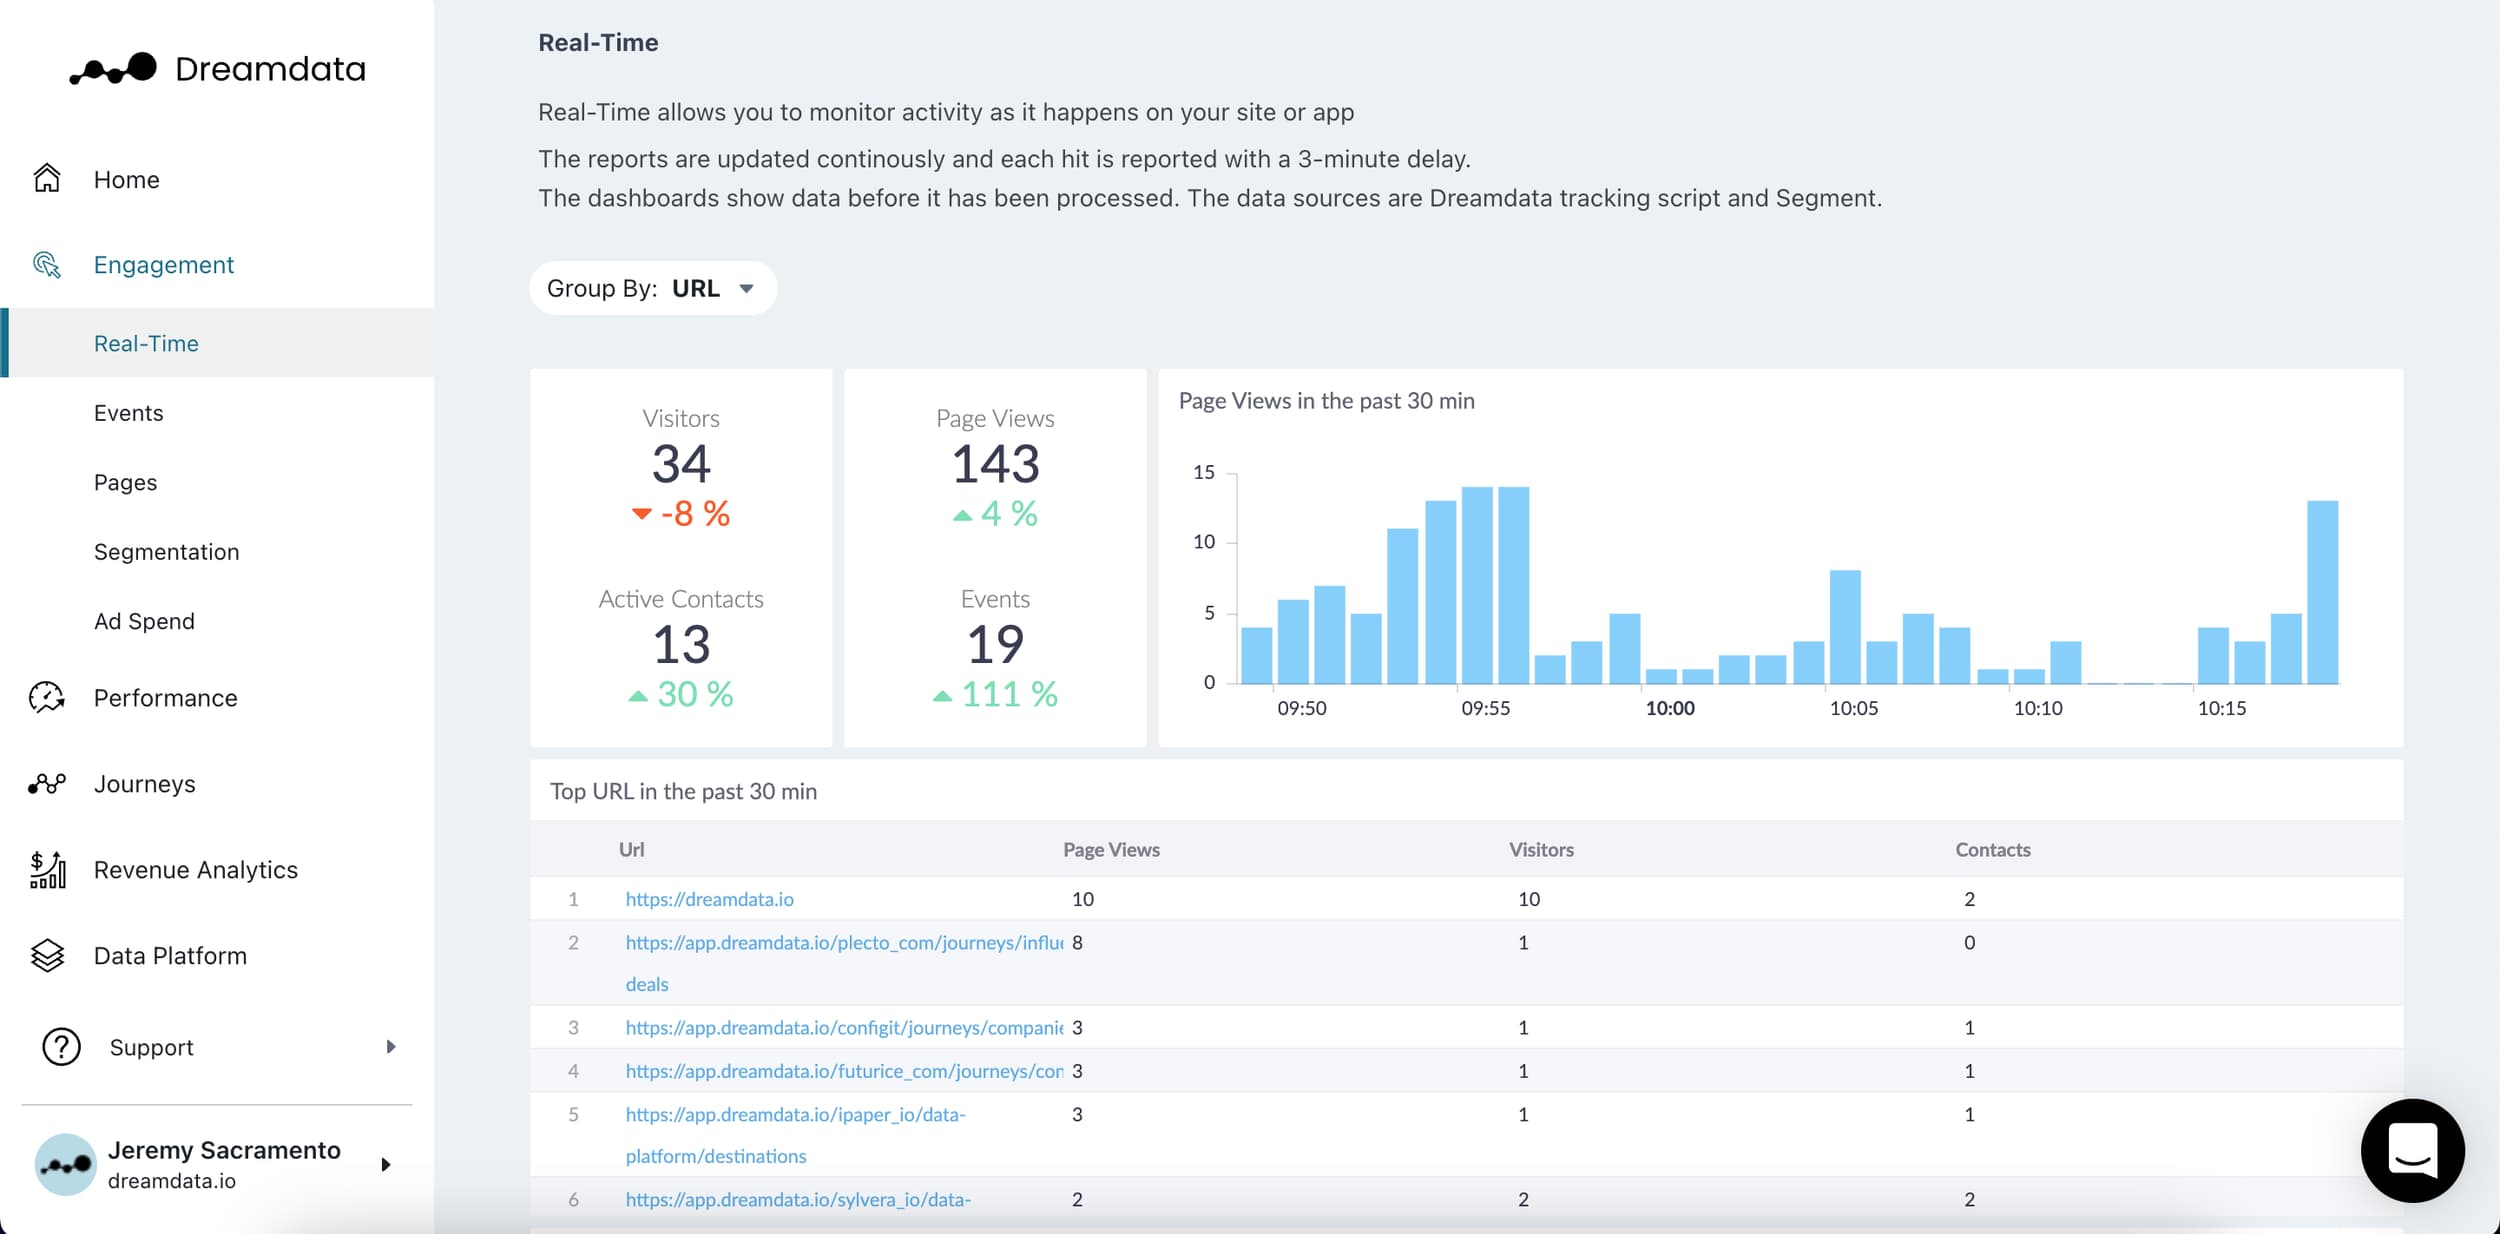
Dreamdata is a multi-touch attribution platform built for companies with long, complex sales cycles. It takes an account-based approach to attribution, tracking every interaction across an entire buying committee rather than isolated user journeys.
Pricing
Dreamdata offers a free plan covering foundational B2B web analytics, company identification, and engagement scoring. Paid plans start at approximately $750/month for Activation Starter, with advanced attribution tiers ranging from $15,000 to $45,000+ per year depending on data volume, account count, and integration requirements.
Recommended Reading: Dreamdata Pricing Review 2026: Costs, Features, ROI
Features & Benefits
- Multi-touch attribution spans the full revenue stack. Dreamdata supports linear, time-decay, U-shaped, and custom attribution models, applied across CRM, ad platforms, marketing automation, intent tools, and web analytics in one unified data layer.
- Data warehouse export is available via BigQuery and Snowflake. Attribution data is not confined to Dreamdata’s interface. Advanced plans include direct warehouse access and reverse ETL into BI tools, supporting teams that require auditable, SQL-queryable data at the infrastructure level.
- HubSpot and Salesforce integrations are native. Both CRMs are supported directly, allowing downstream events such as SQL creation and closed-won deals to feed back into ad platforms and inform campaign optimisation with actual revenue data.
Cons
- Implementation takes 4–8 weeks before data becomes reliable. Setup requires clean CRM mapping and consistent UTM tracking, which slows onboarding for teams without dedicated marketing ops support.
- Pricing requires a procurement process. Enterprise pricing and annual contracts introduce friction for teams still validating attribution ROI or securing budget approval.
- Anonymous journey tracking has documented limitations. Early-stage, pre-identification interactions are inconsistently captured, creating visibility gaps at the top of the funnel.
- Platform complexity increases with feature depth. Advanced capabilities carry a steeper learning curve, and teams without RevOps support may underutilize the platform initially.
3. HockeyStack
Best for: Enterprise B2B teams that need account-level revenue attribution, GTM intelligence, and AI-powered insights across marketing and sales.
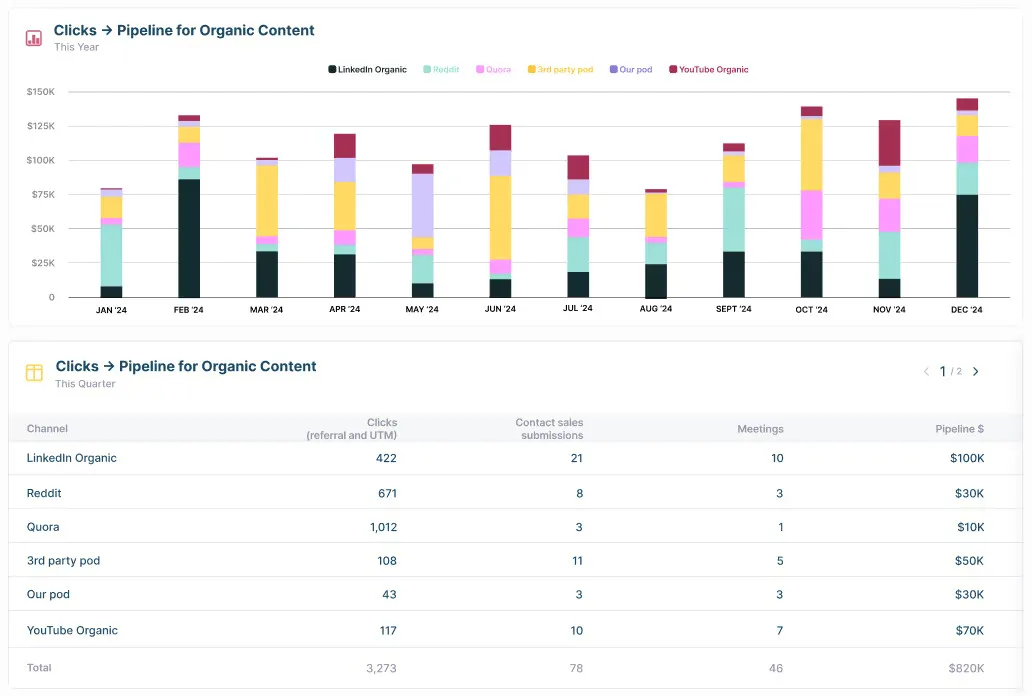
HockeyStack is a go-to-market intelligence platform that combines multi-touch attribution, account analytics, and sales insights into one revenue reporting system. It connects marketing, sales, CRM, and product data to show how different channels, campaigns, and interactions influence pipeline and closed revenue across complex B2B buying journeys.
Pricing
HockeyStack does not publish standard pricing. Plans are custom-quoted based on the number of tracked accounts, connected data sources, and feature modules required. Reported annual contract values typically range from $15,000 to $50,000+, with a median around $28,000 according to third-party procurement data. Teams should expect a sales-led process before receiving a formal quote.
Recommended Reading: HockeyStack Pricing Review 2026: Costs, Features, ROI
Features & Benefits
- Account-level multi-touch attribution across the GTM funnel. HockeyStack tracks how multiple marketing and sales interactions contribute to revenue, helping teams understand complex buying journeys involving multiple stakeholders.
- AI-powered revenue insights with natural language analysis. Teams can query performance data and uncover insights without manually building reports, helping marketing and revenue leaders analyse campaign impact faster.
- Unified marketing and sales data layer. HockeyStack connects CRM, advertising, website, and sales engagement data to create a shared view of revenue performance across teams.
Cons
- Enterprise pricing limits accessibility for smaller teams. Custom contracts and higher annual costs make HockeyStack better suited for organisations with established attribution budgets.
- Implementation requires stronger technical resources. Connecting multiple data sources and configuring revenue workflows can require marketing operations or RevOps support.
- Attribution is part of a broader GTM platform. Teams looking specifically for a dedicated multi-touch attribution platform may find the broader sales intelligence features unnecessary.
4. Factors.ai
Best for: Marketing teams needing cross-channel attribution, campaign measurement, and customer journey analysis across multiple digital touchpoints.
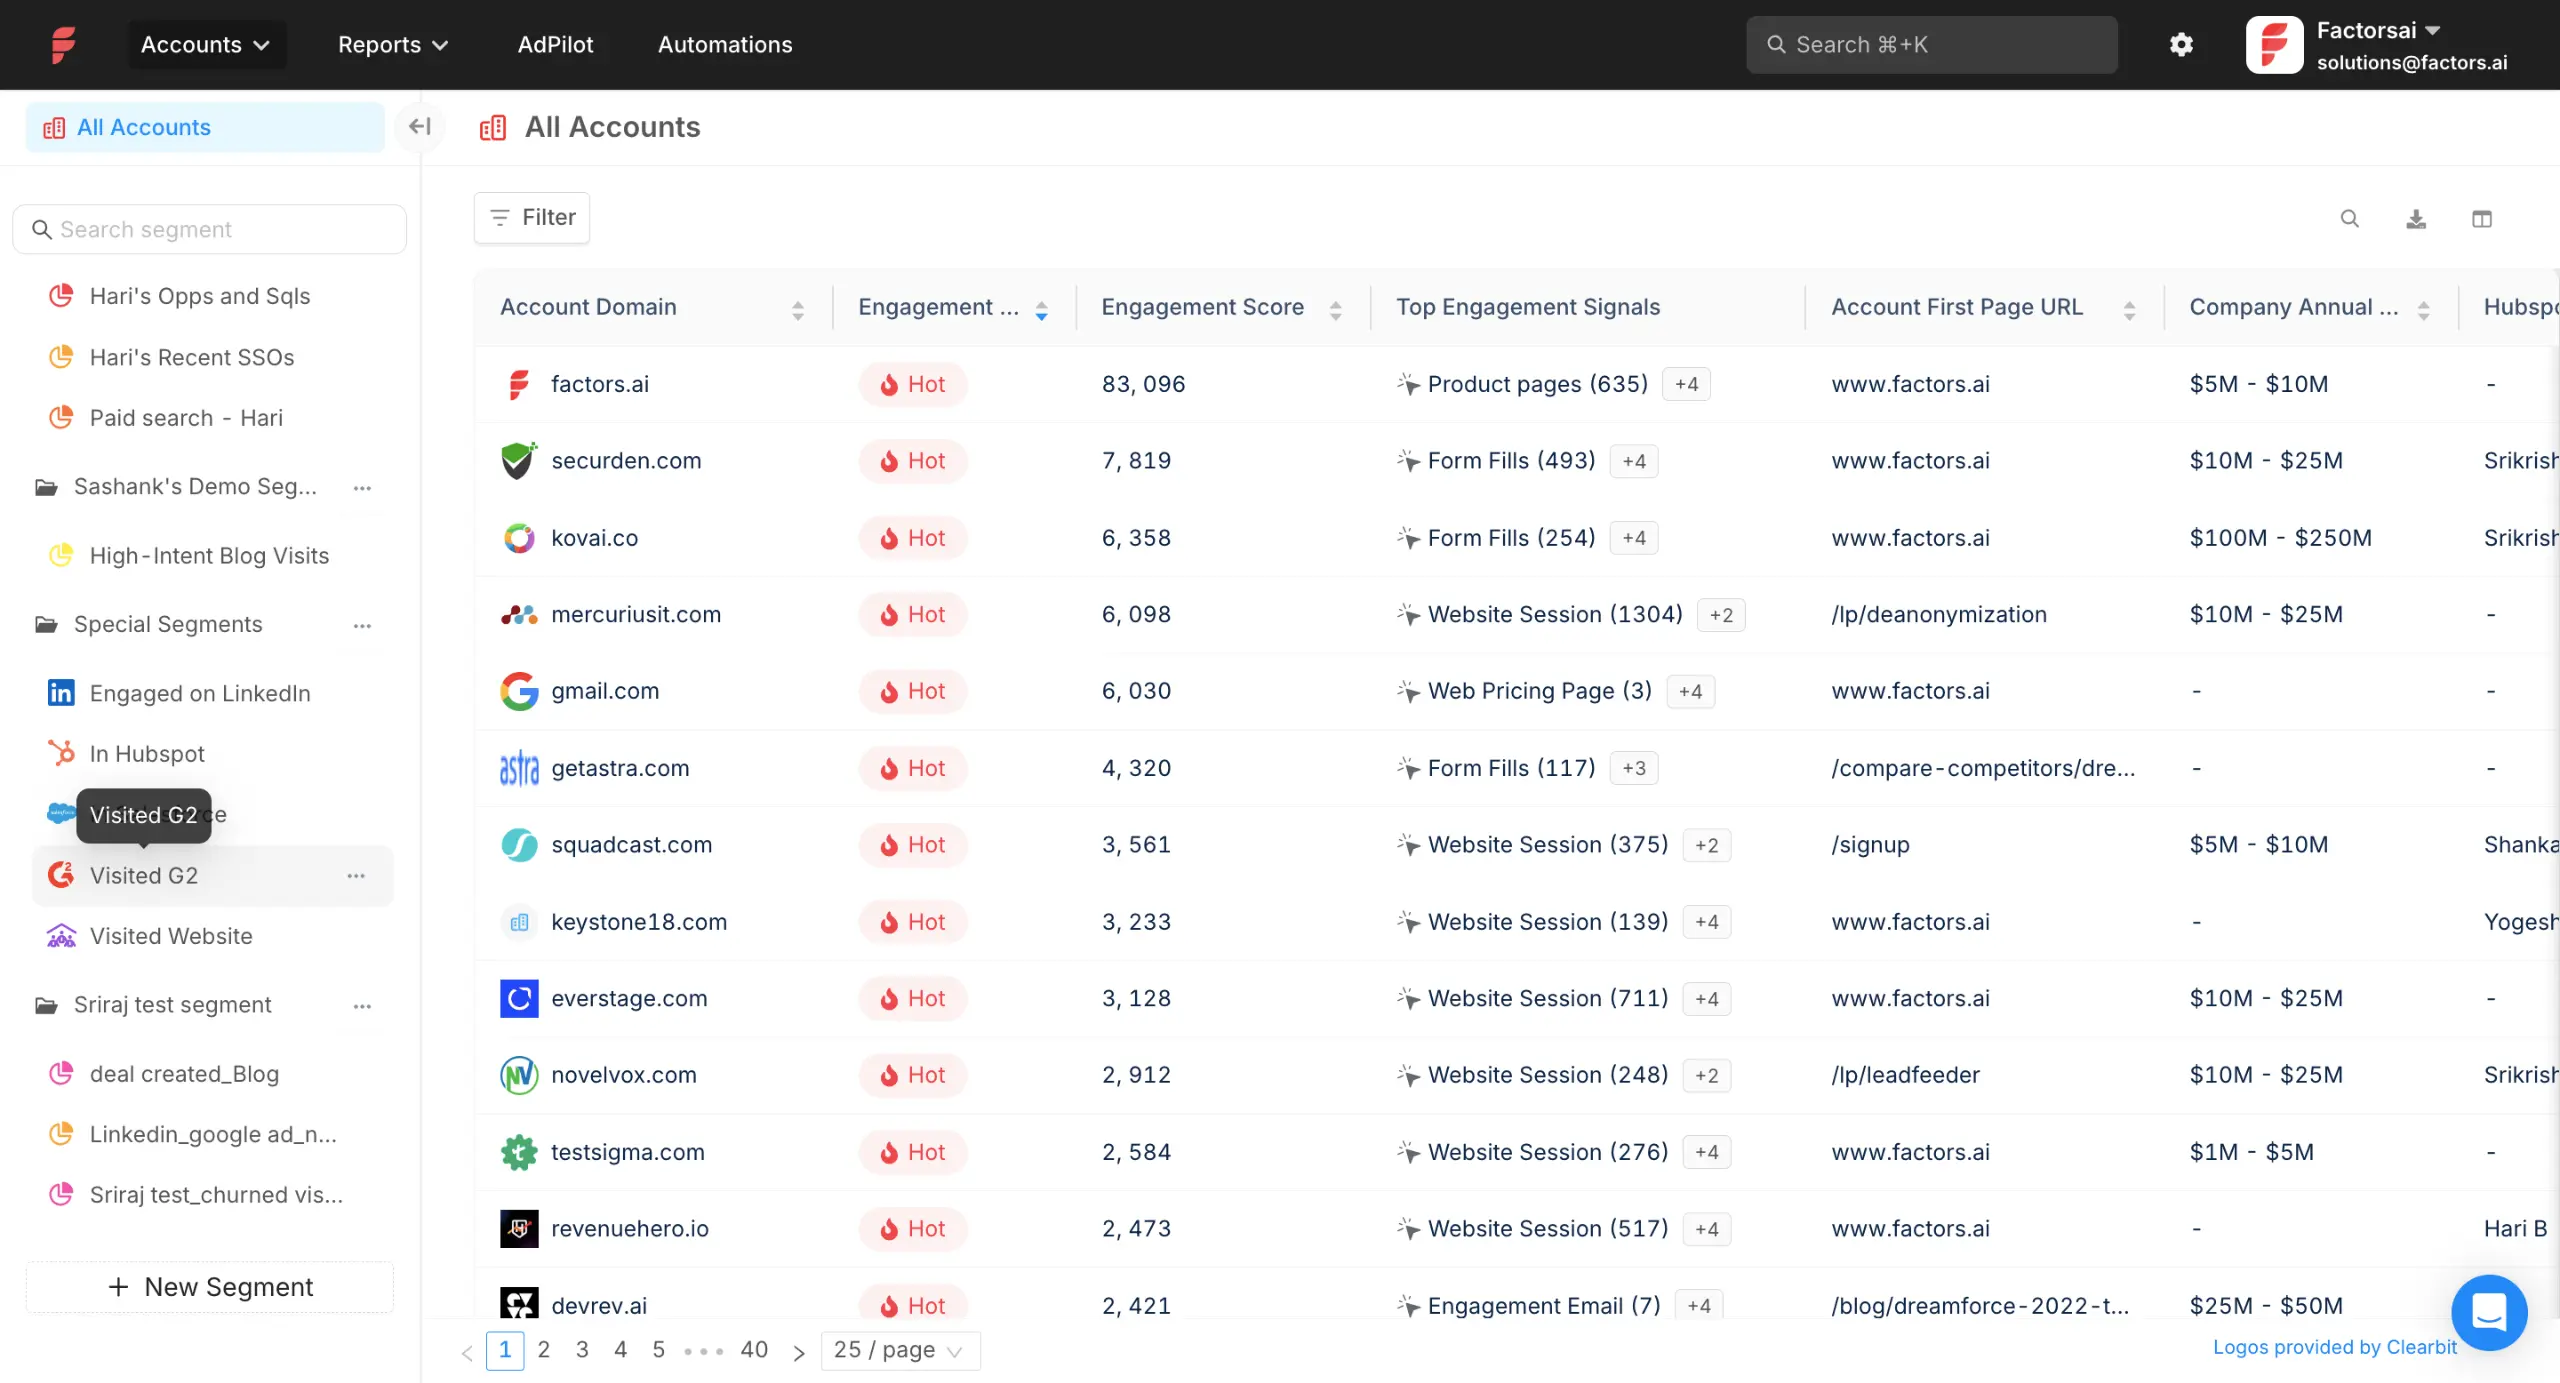
Factors.ai is a marketing attribution and revenue intelligence platform that helps teams measure how different campaigns, channels, and customer interactions contribute to pipeline and revenue. It combines multi-touch attribution with account intelligence and campaign analytics to give marketing teams a broader view of performance across the buyer journey.
Pricing
Factors.ai offers custom pricing based on data volume, integrations, and reporting requirements. Public pricing information has historically shown plans starting around $399/month, with enterprise packages increasing based on team requirements and data complexity.
Features & Benefits
- Seven built-in attribution models support flexible conversion goals. Teams can run attribution against any website or CRM conversion goal, MQL, SQL, demo booked, closed-won, across seven model types including first-touch, last-touch, linear, time-decay, and U-shaped, with unsampled data at every tier.
- Account identification integrates G2 and intent data. Beyond reverse IP lookup for website visitors, Factors layers in G2 buyer intent signals and cross-channel engagement scoring, helping sales teams prioritise outreach based on which accounts are showing in-market behaviour across multiple surfaces simultaneously.
Cons
- Add-on costs escalate quickly. Core attribution is accessible at entry-level pricing, but modules like LinkedIn AdPilot, Google AdPilot, and intent data packages are priced separately, meaning the total cost of a full-feature deployment can climb significantly above the headline tier rate.
- Reporting customisation is limited out of the box. Pre-built dashboards cover most core use cases but offer limited flexibility for highly bespoke or non-standard reporting.
5. Rockerbox
Best for: Enterprise organisations running mixed online and offline media, TV, OTT, podcasts, direct mail, that need a single measurement framework across all channels.
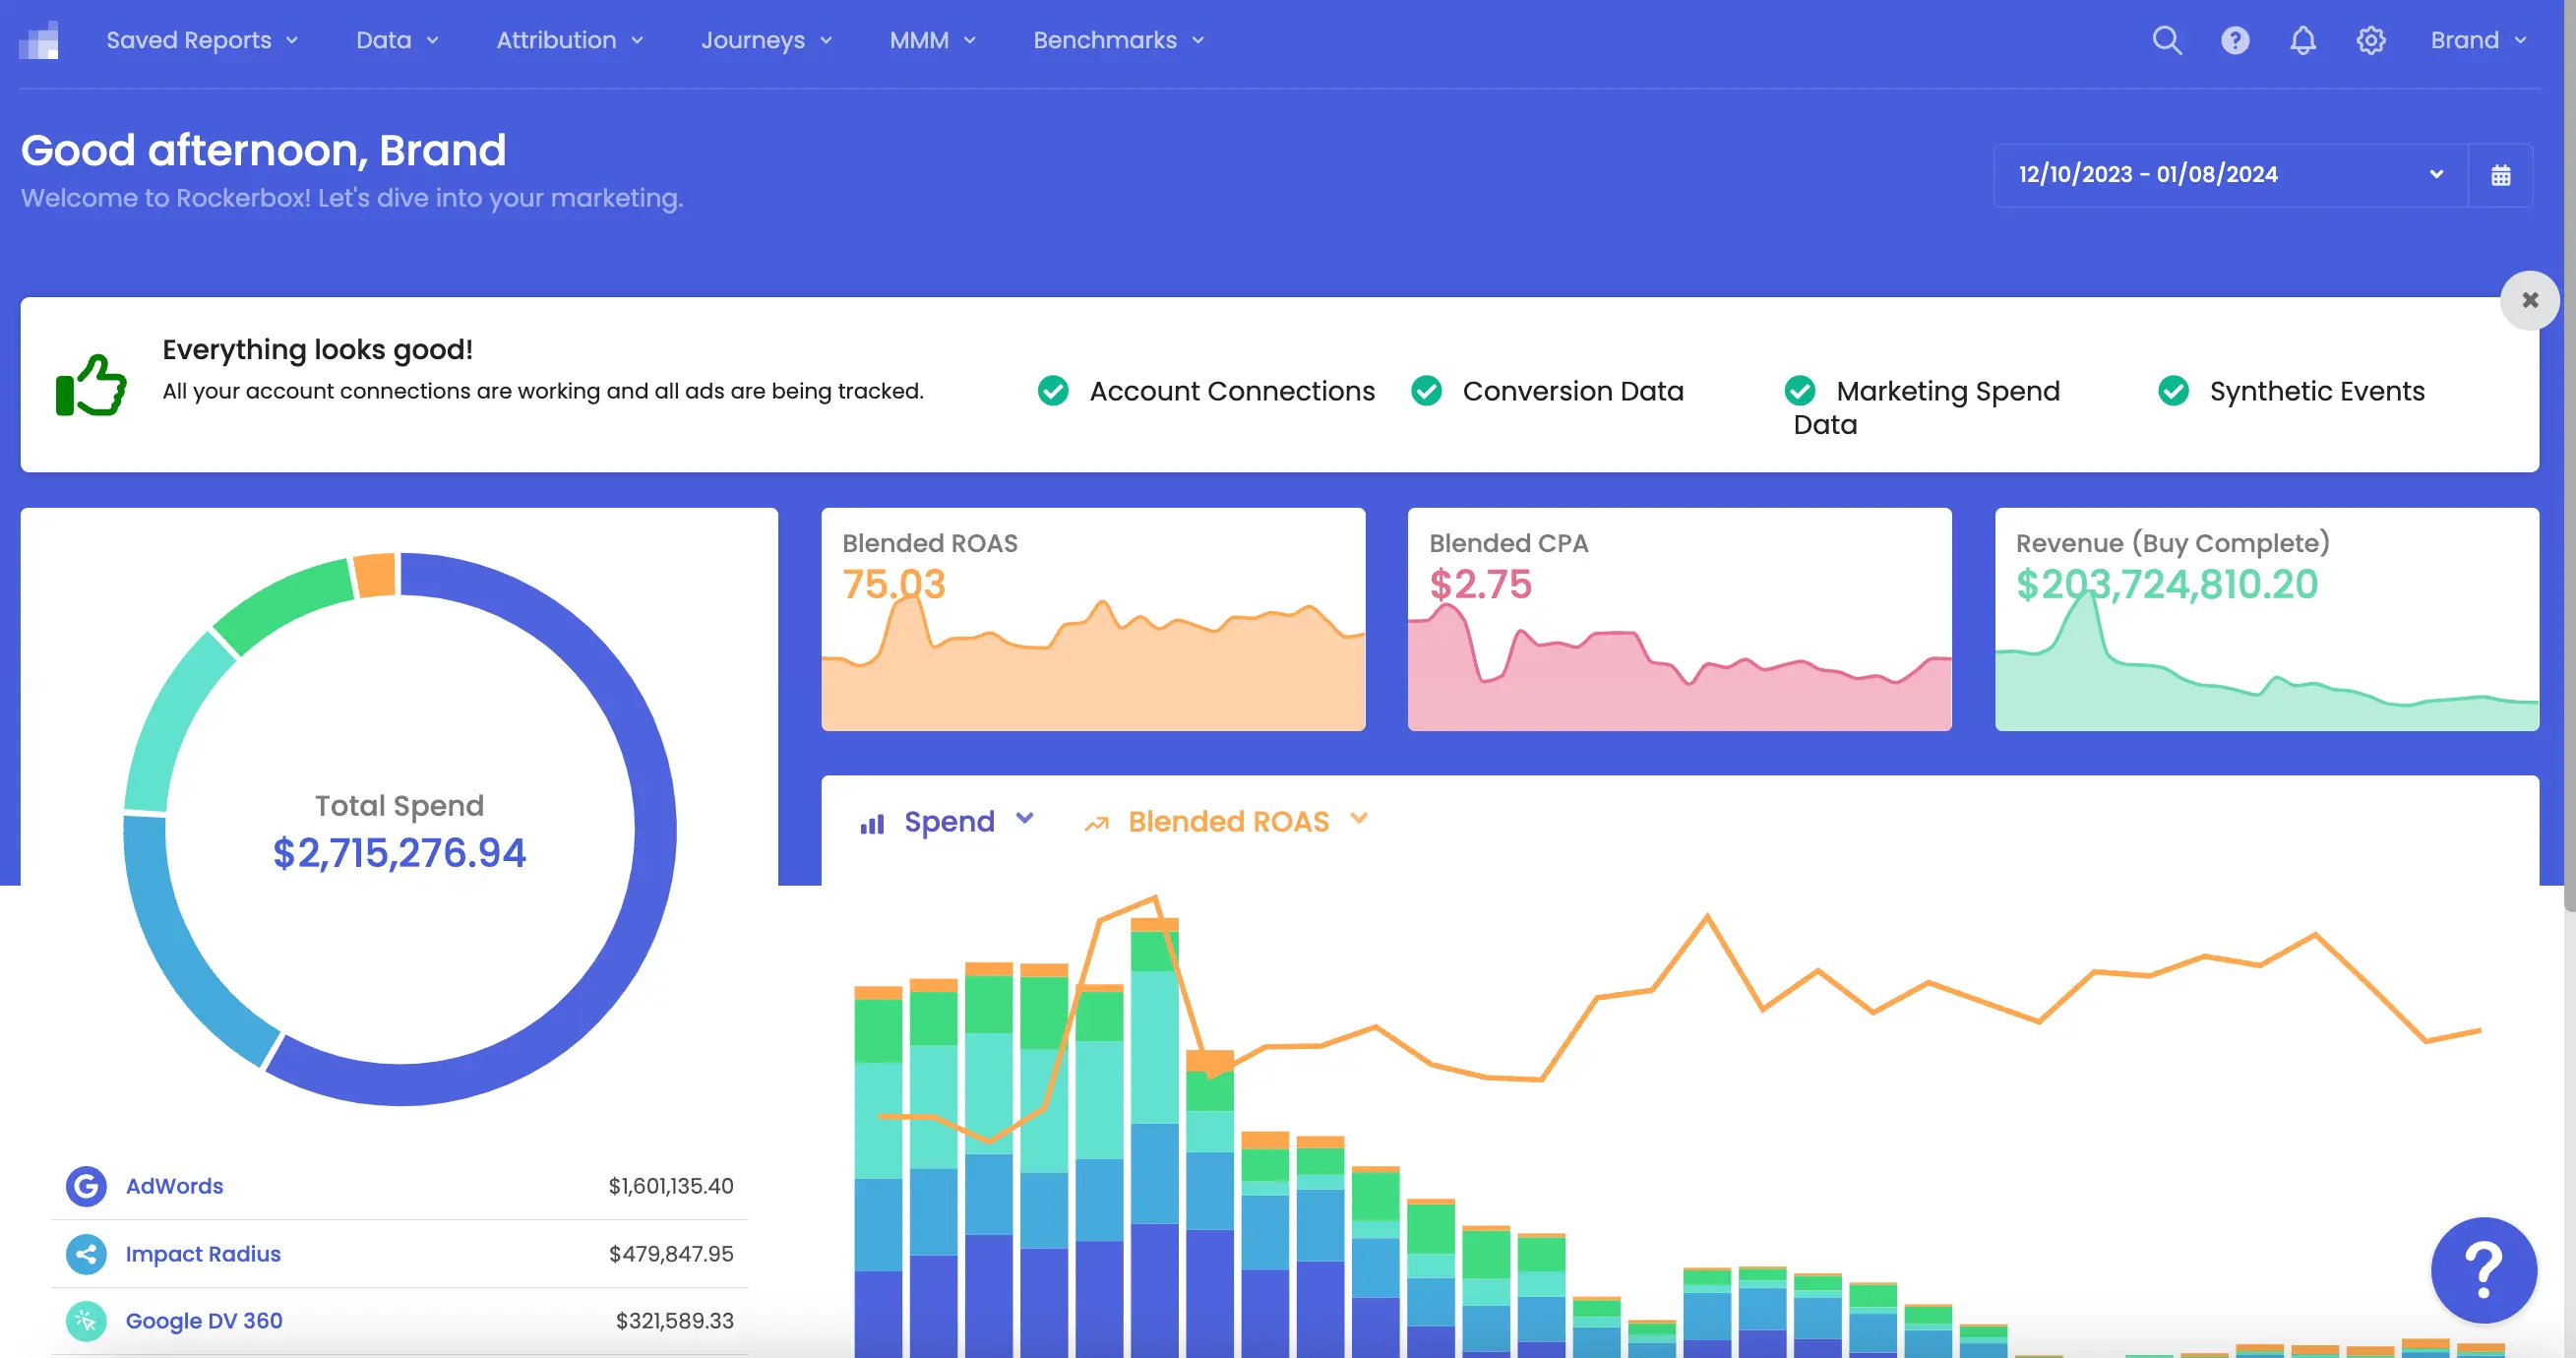
Rockerbox is an enterprise marketing measurement platform that combines multi-touch attribution, marketing mix modelling, and incrementality testing under one roof. Its distinguishing feature is channel breadth: TV, OTT, podcasts, direct mail, and other offline media sit alongside digital channels in a unified measurement framework.
Pricing
Rockerbox uses custom, enterprise pricing with no published rates. Quotes are based on company size, data volume, and the specific measurement modules required. Third-party procurement estimates suggest annual costs typically range from $90,000 to $160,000 for enterprise deployments.
Features & Benefits
- MTA, MMM, and incrementality testing run in a single platform. Rather than running multi-touch attribution and marketing mix modelling as separate workstreams, Rockerbox combines them alongside geo-lift and in-channel incrementality tests, giving media teams a more complete and cross-validated view of true channel contribution.
- Offline channels are tracked alongside digital. TV, radio, direct mail, podcasts, OTT, and retail media are measured within the same attribution framework as paid search, social, and display, eliminating the blind spots that make budget allocation decisions unreliable for teams with significant offline investment.
- Data warehouse integration and a first-party pixel support data governance. Rockerbox connects directly with data warehouses and supports a self-hostable first-party pixel. Its integrations span major ad platforms including Facebook, Google, LinkedIn, TikTok, Snap, and Pinterest, with industry benchmark data available for contextualising ROAS performance.
Cons
- Rockerbox is not purpose-built for B2B pipeline attribution. Its strength is broad channel coverage and mixed media measurement. Teams whose primary question is which marketing activities drove CRM pipeline and closed-won revenue will find dedicated B2B attribution platforms like Dreamdata better suited to account-level, CRM-connected reporting.
- Implementation requires dedicated developer resource. Initial setup is technically complex and time-consuming, typically requiring engineering support.
- The DoubleVerify acquisition creates product roadmap uncertainty. The March 2025 acquisition by DoubleVerify, a brand safety and verification company, raises questions about where Rockerbox's measurement capabilities are headed, particularly for teams making multi-year investment decisions and evaluating long-term vendor stability.
6. Triple Whale
Best for: Shopify-based DTC brands that need ecommerce attribution, customer analytics, and marketing performance reporting across paid channels.
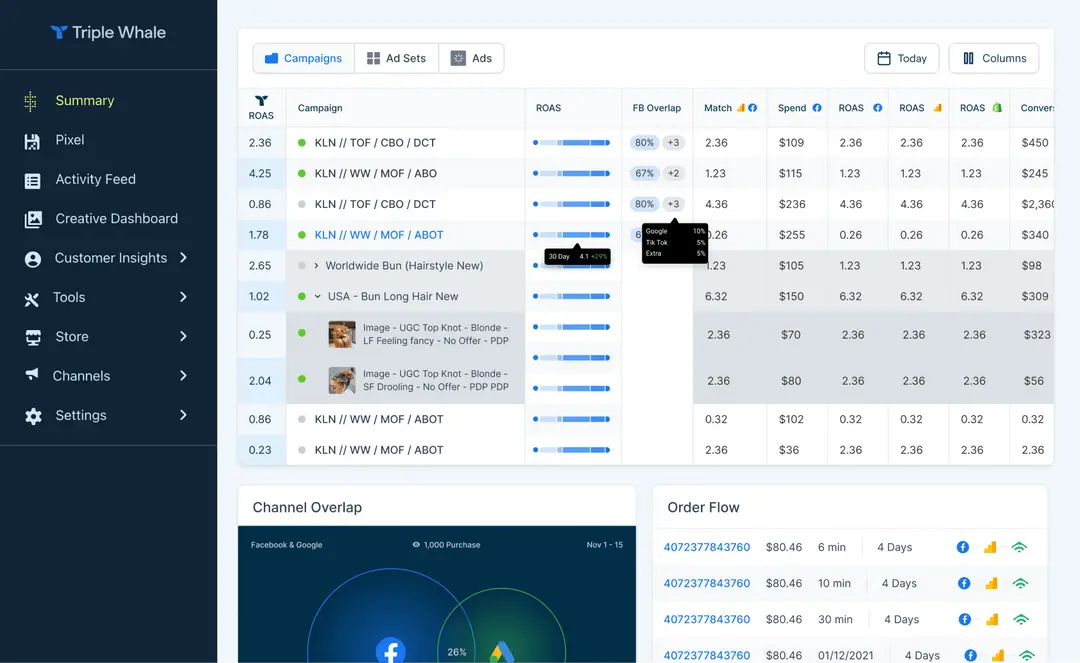
Triple Whale is an ecommerce analytics platform built for direct-to-consumer brands that need visibility into marketing performance, customer acquisition, and revenue attribution. It connects Shopify data with advertising platforms and customer behaviour data to help ecommerce teams understand which campaigns and channels contribute to sales.
Pricing
Triple Whale offers a free Founders Dashboard with high-level Shopify and ad platform data. Paid plans are priced against the brand’s gross revenue over the last 12 months, starting at $129/month for brands under $250K GMV and scaling up to $3,599/month for brands approaching $50M. Above $50M, custom enterprise pricing applies.
Features & Benefits
- The Triple Pixel captures first-party conversion data post-iOS 14. This proprietary pixel captures conversion data server-side, bypassing signal loss from browser privacy restrictions, giving DTC brands more accurate ROAS reporting across Meta, Google, and TikTok than relying on platform-reported metrics alone.
- A unified profit dashboard includes industry benchmarking. Blended ROAS, contribution margin, and customer acquisition costs are displayed alongside industry percentile benchmarks, giving operators context for performance rather than absolute numbers in isolation, which aids budget allocation decisions across fast-moving campaigns.
- AI agents automate marketing reporting. Automated reporting, anomaly detection, and natural-language campaign queries reduce the manual analysis burden for lean eCommerce marketing teams managing high spend across multiple platforms simultaneously.
Cons
- Triple Whale is not designed for B2B sales cycles or CRM pipeline attribution. It has no native account-level attribution, no buying committee tracking, and no meaningful integration with Salesforce or HubSpot pipeline data. It measures Shopify conversions, not multi-month enterprise deals moving through a CRM, making it a poor fit for B2B SaaS attribution needs.
- GMV-based pricing scales aggressively with revenue growth. Costs are tied to gross merchandise value, meaning fast-growing brands pay significantly more as they scale. A brand at $6M GMV can expect to pay over $1,100/month, with costs rising sharply above that threshold.
- Reporting depth is limited below the channel level. Reporting is strong at the channel and campaign level but less granular at the product, cohort, or customer lifetime value level. Teams needing SKU-level attribution, subscription revenue insights, or retention-focused LTV modelling may find the platform's scope constraining.
7. Google Analytics 4
Best for: Teams that need a free, foundational web analytics layer before evaluating a dedicated multi-touch attribution platform.
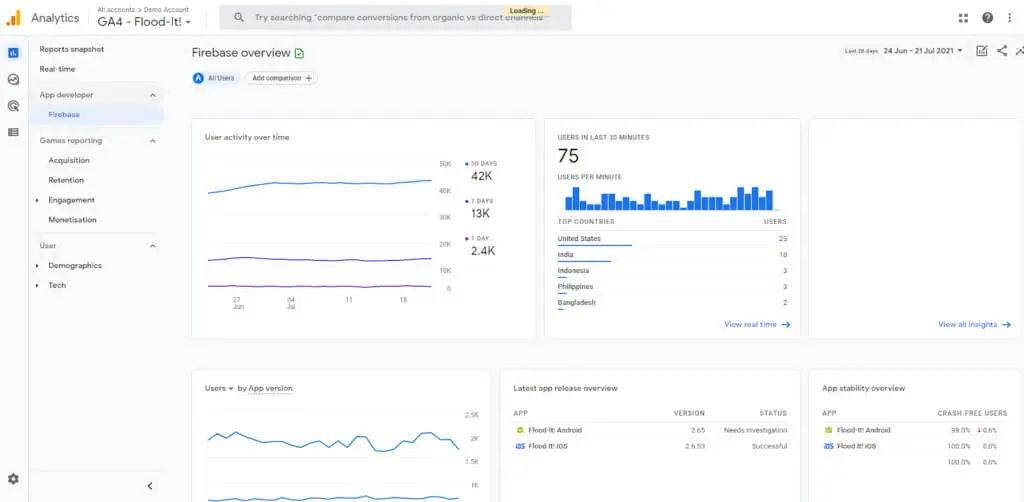
Google Analytics 4 is the most widely deployed analytics platform in the world and, for most teams, a standard part of the measurement stack. Its event-based data model, native BigQuery export, and deep integration with Google Ads make it a strong foundation for web analytics and funnel analysis.
Pricing
Google Analytics 4 is free for the standard tier, which covers up to 10 million events per month, 14 months of exploration data retention, free BigQuery export, and the full Explorations suite. GA4 360, the enterprise tier, removes sampling limits, extends data retention to 50 months, and includes an SLA and dedicated support. It is sold through Google Marketing Platform resellers and typically costs in the range of $50,000–$150,000+ per year depending on hit volume, though pricing is negotiated directly and varies significantly.
Features & Benefits
- Data-driven attribution is the default model. GA4 uses machine learning to assign conversion credit based on the actual statistical contribution of each touchpoint, a significant improvement over rule-based models. For teams with sufficient conversion volume, approximately 600+ conversions per month per conversion action, this delivers more accurate channel-level insights than fixed positional models.
- Free BigQuery export enables SQL-level analysis. Every event streams to BigQuery daily at no additional cost, enabling teams to join GA4 data with CRM records, ad spend data, and other sources for custom attribution modelling and full-funnel analysis that goes beyond what the GA4 UI itself supports.
- Native Google ecosystem integration anchors Google-centric strategies. Seamless connections to Google Ads, Search Console, and Looker Studio make GA4 the natural anchor for teams running Google-centric paid strategies.
Cons
- Attribution model choice has been significantly narrowed. Google has retired first-click, linear, time-decay, and position-based attribution models from GA4, leaving only last-click and data-driven as supported options.
- GA4 provides no account-level tracking for B2B buying committees.In B2B SaaS, where five to ten stakeholders may interact with your content before a deal closes, GA4 provides no mechanism to stitch those individual journeys into a single account-level view, which is fundamental to understanding enterprise pipeline attribution.
- Data sampling limits reliability at scale. Exploration reports trigger aggressive sampling on large datasets, which can distort channel-level attribution insights for high-traffic properties. GA4 360 removes most sampling limits but carries a significant cost, creating a notable capability gap between the free and enterprise tiers.
How to Choose the Right Multi-Touch Attribution Software for Your Stage
Choosing the right multi-touch attribution software depends on your CRM, sales cycle complexity, marketing channels, and technical resources.
HubSpot-based B2B teams needing content and campaign attribution should start with AttributeIQ. Companies with complex account-based sales cycles should evaluate Dreamdata or HockeyStack. Ecommerce brands should consider Triple Whale, while teams with significant offline spend may need Rockerbox.
Here’s a deeper breakdown by CRM, team setup, and where to start.
6 Mistakes to Avoid When Choosing a Multi-Touch Attribution Software Vendor
Choosing the wrong multi-touch attribution software vendor can lead to unreliable revenue reporting, difficult implementations, and wasted budget. Before buying, B2B teams should avoid these six common mistakes when evaluating attribution platforms.
What to Do After Choosing a Multi-Touch Attribution Software
Once you’ve selected the right multi-touch attribution software, the next challenge is making sure it delivers on the promise. The first 90 days are where teams validate data accuracy, align stakeholders, and build the processes needed to turn attribution insights into confident marketing decisions.
The best way to evaluate attribution software is to see how it works with your own data. Start your free AttributeIQ trial, explore buyer journeys, validate reporting accuracy, and decide if it gives your team the visibility needed to make better marketing decisions.